
Candles
Each candle shows a bar's open, high, low and close: the body spans the open and the close, the wicks reach the high and the low. Green when the close is at or above the open, red when it is below.
- See each bar's open, high, low and close, and which side won the bar.
- The reference view for drawing tools and chart patterns.
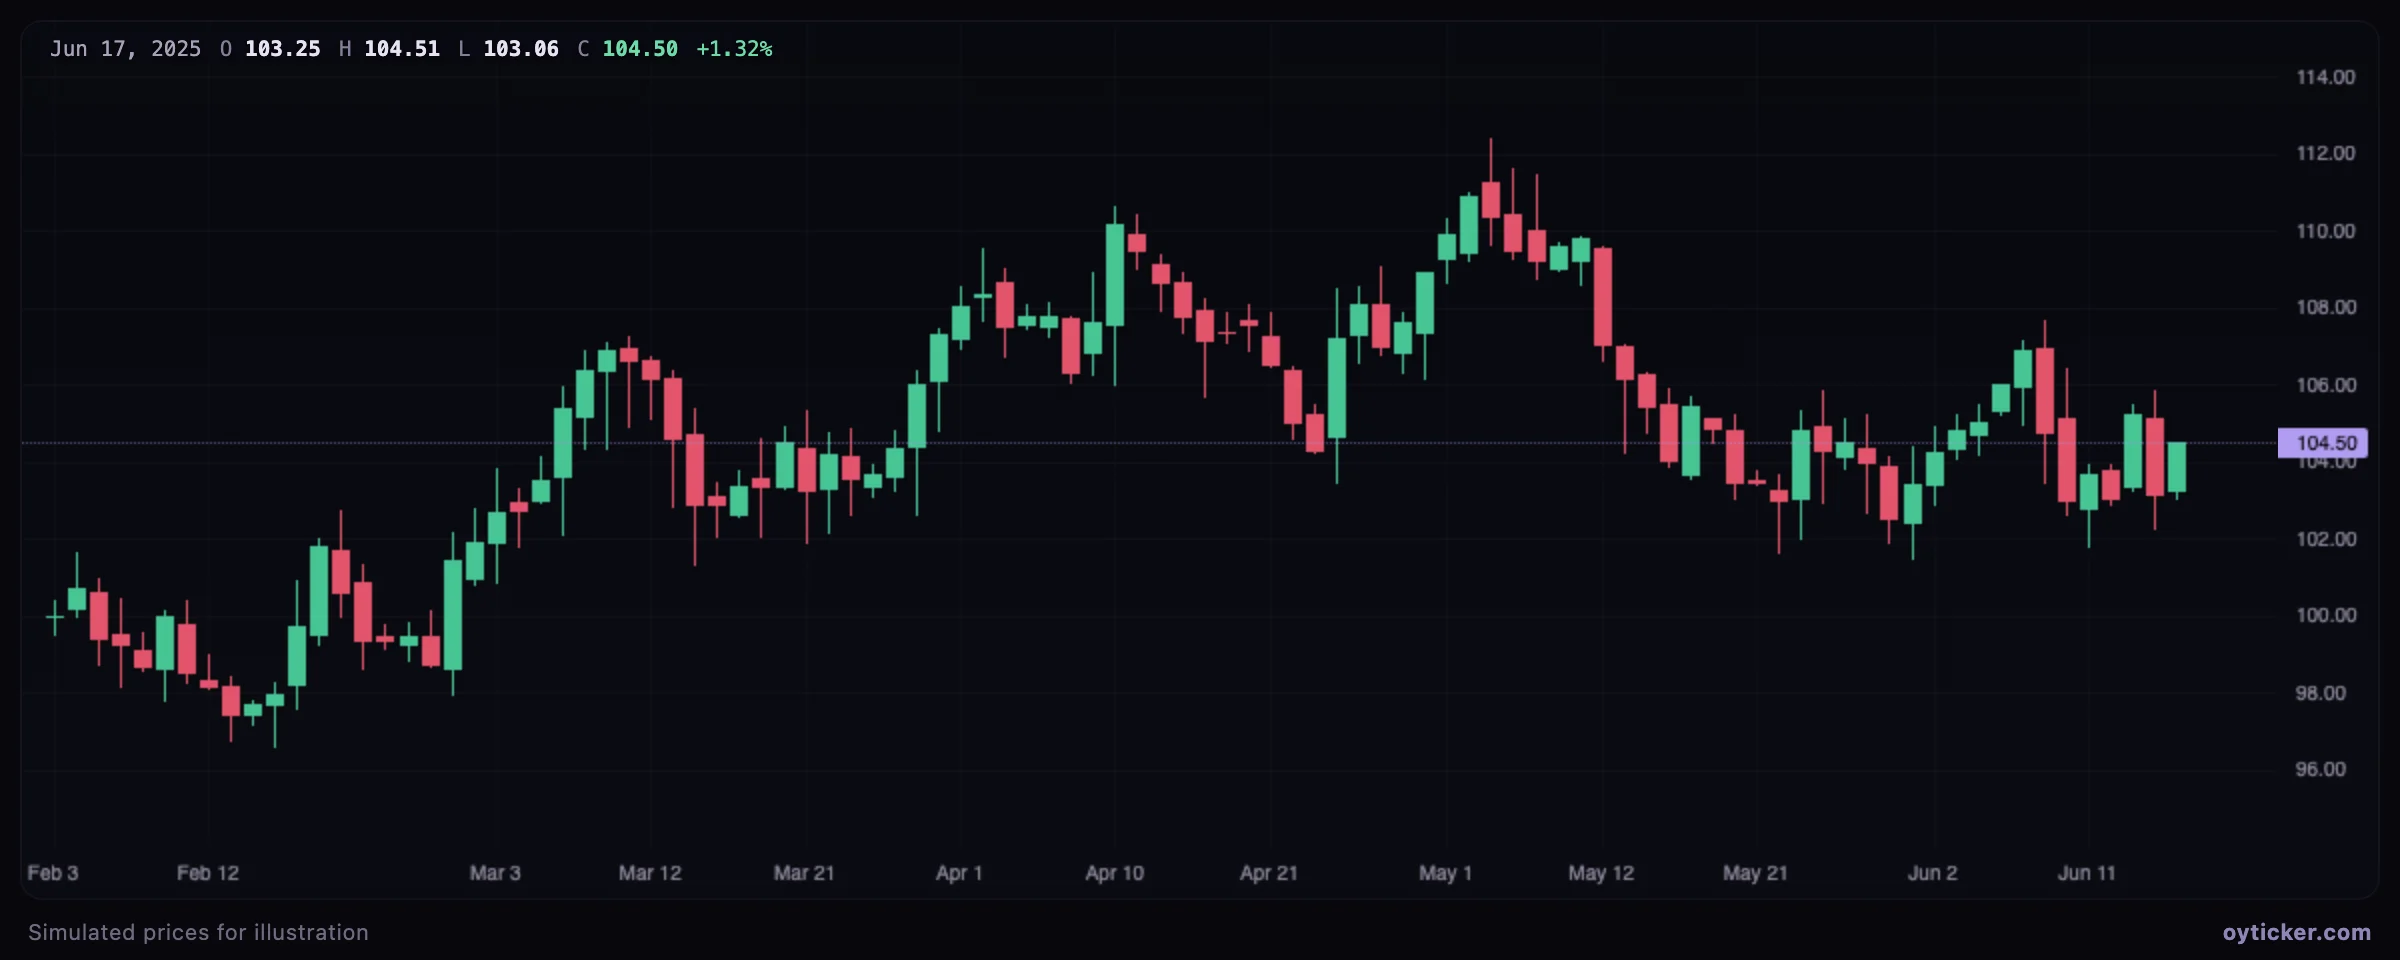
Candles show at a glance who won the bar (body color and size) and how far each side pushed (wicks). Long lower wicks show rejected selling, long upper wicks rejected buying. They are the reference chart for almost every tool in these guides.
Hollow candles
Hollow candles encode two comparisons in one candle: the fill shows the close against the open (hollow when the close is above the open), the color shows the close against the previous close (green when higher or equal, red when lower).
- Read in one candle both the direction within the bar (close vs open) and the change from the previous close.
- Spot reversals within the bar after a gap.
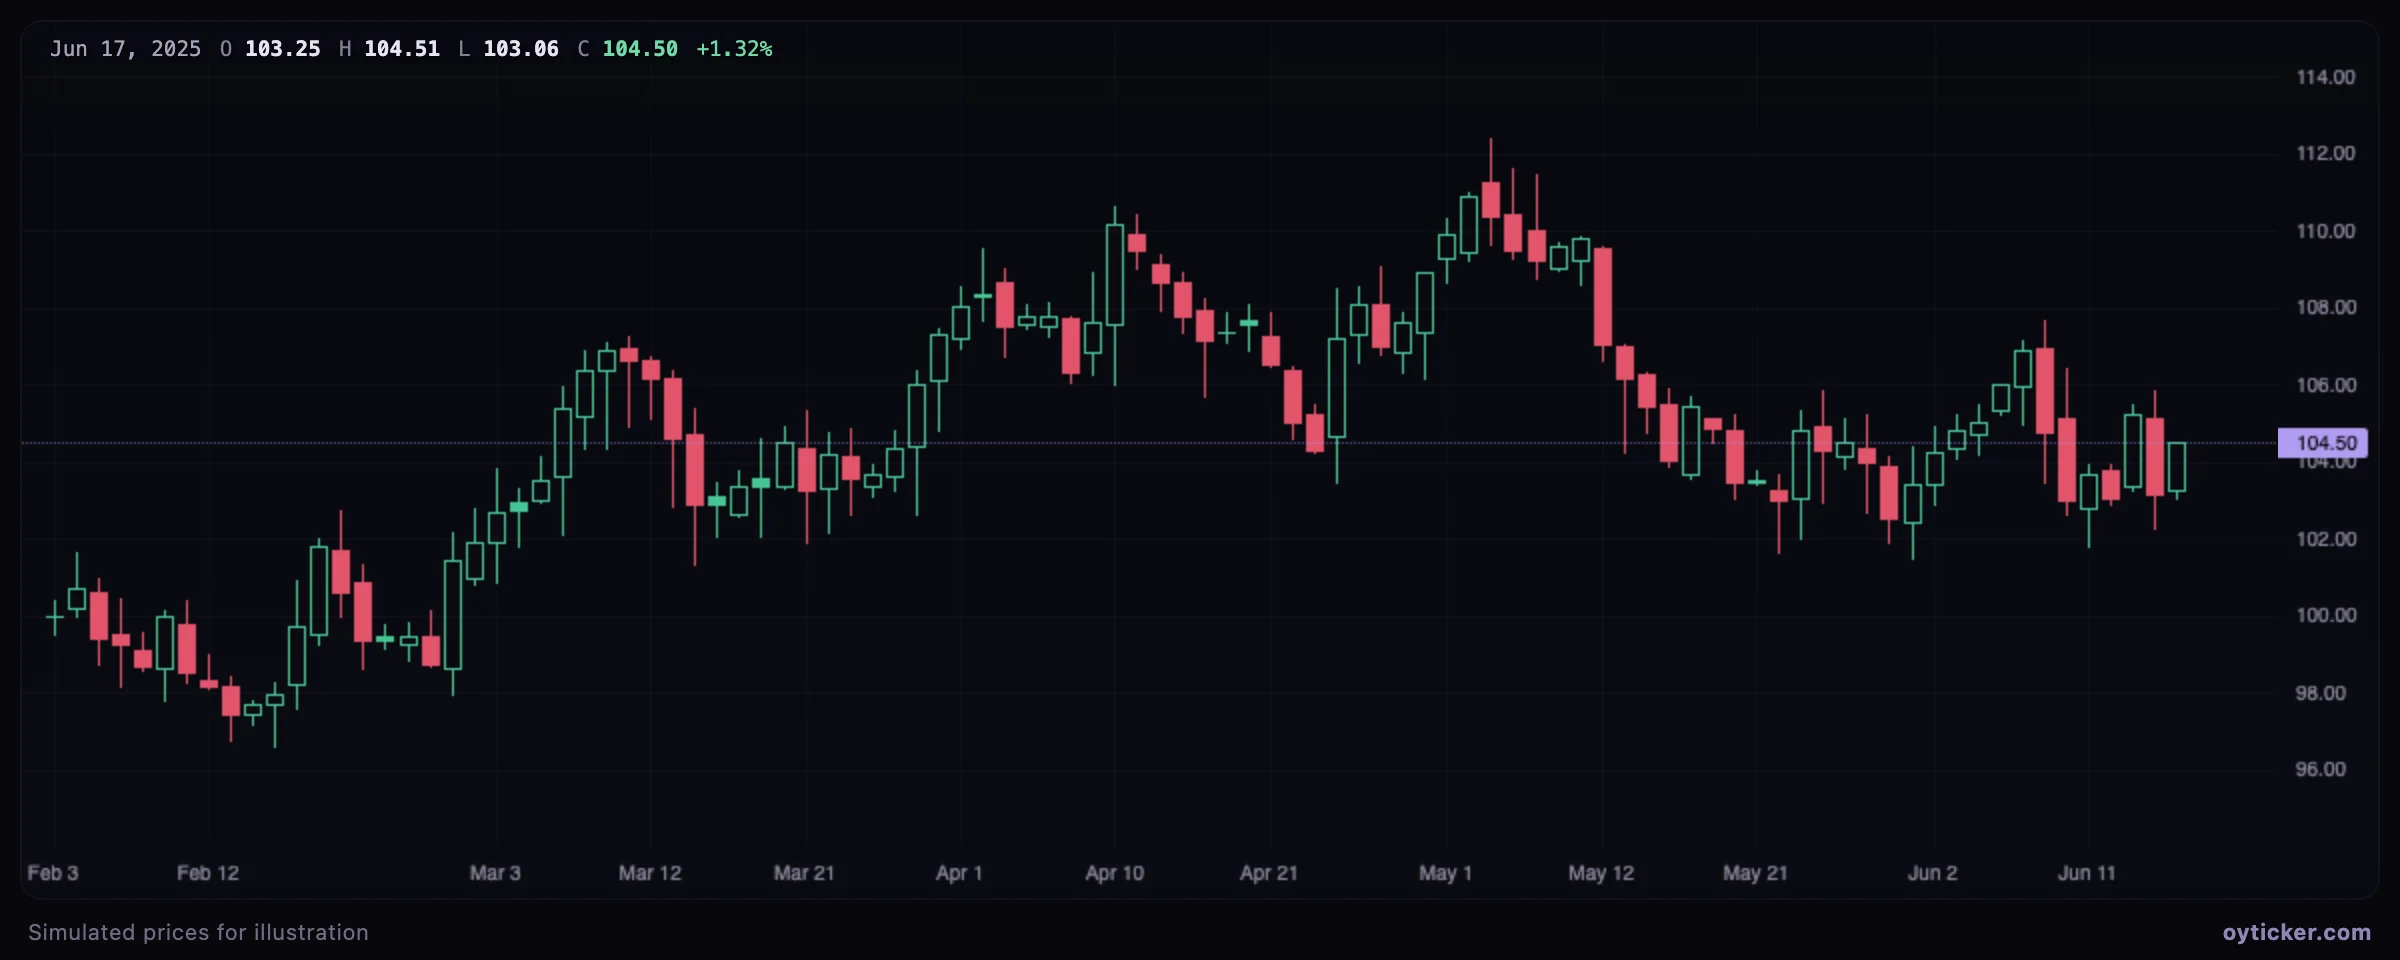
| Candle | Close vs open | Close vs previous close |
|---|---|---|
| Hollow green | Above | Higher or equal |
| Hollow red | Above | Lower |
| Filled green | At or below | Higher or equal |
| Filled red | At or below | Lower |
This is TradingView's convention. The extra information is the intraday reversal: a filled green candle opened above the previous close and sold off, yet still closed higher than the day before.
Heikin Ashi
Heikin Ashi (“average bar” in Japanese) candles are computed from averages, which smooths the chart: trends show as long runs of one color with few opposite candles.
- Smooth the chart to see trend runs more clearly.
- Filter out isolated opposite candles in trends (the prices shown are averages, not traded prices).
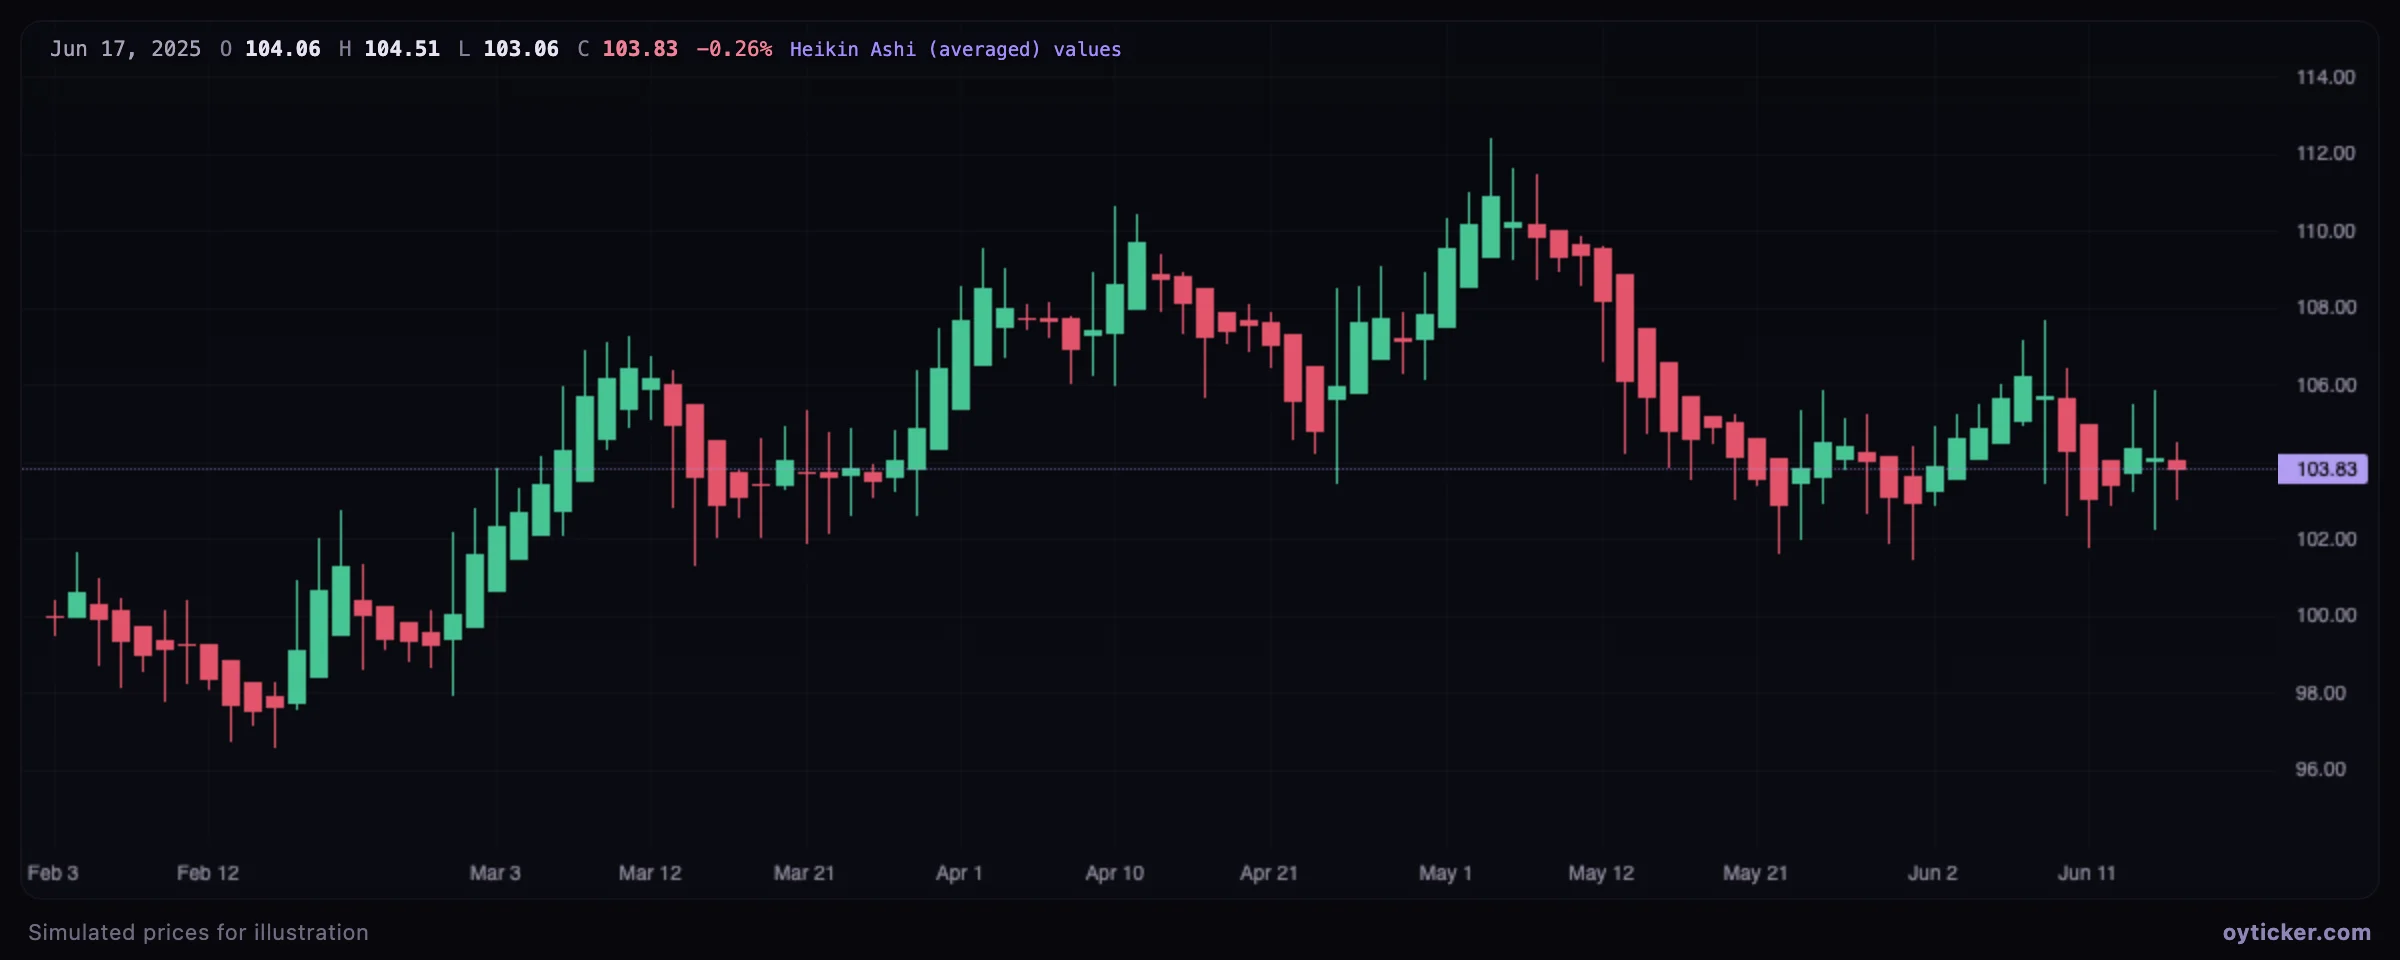
HA close = (open + high + low + close) / 4
HA open  = (previous HA open + previous HA close) / 2       first bar: (open + close) / 2
HA high  = max(high, HA open, HA close)
HA low   = min(low, HA open, HA close)
Bars (OHLC)
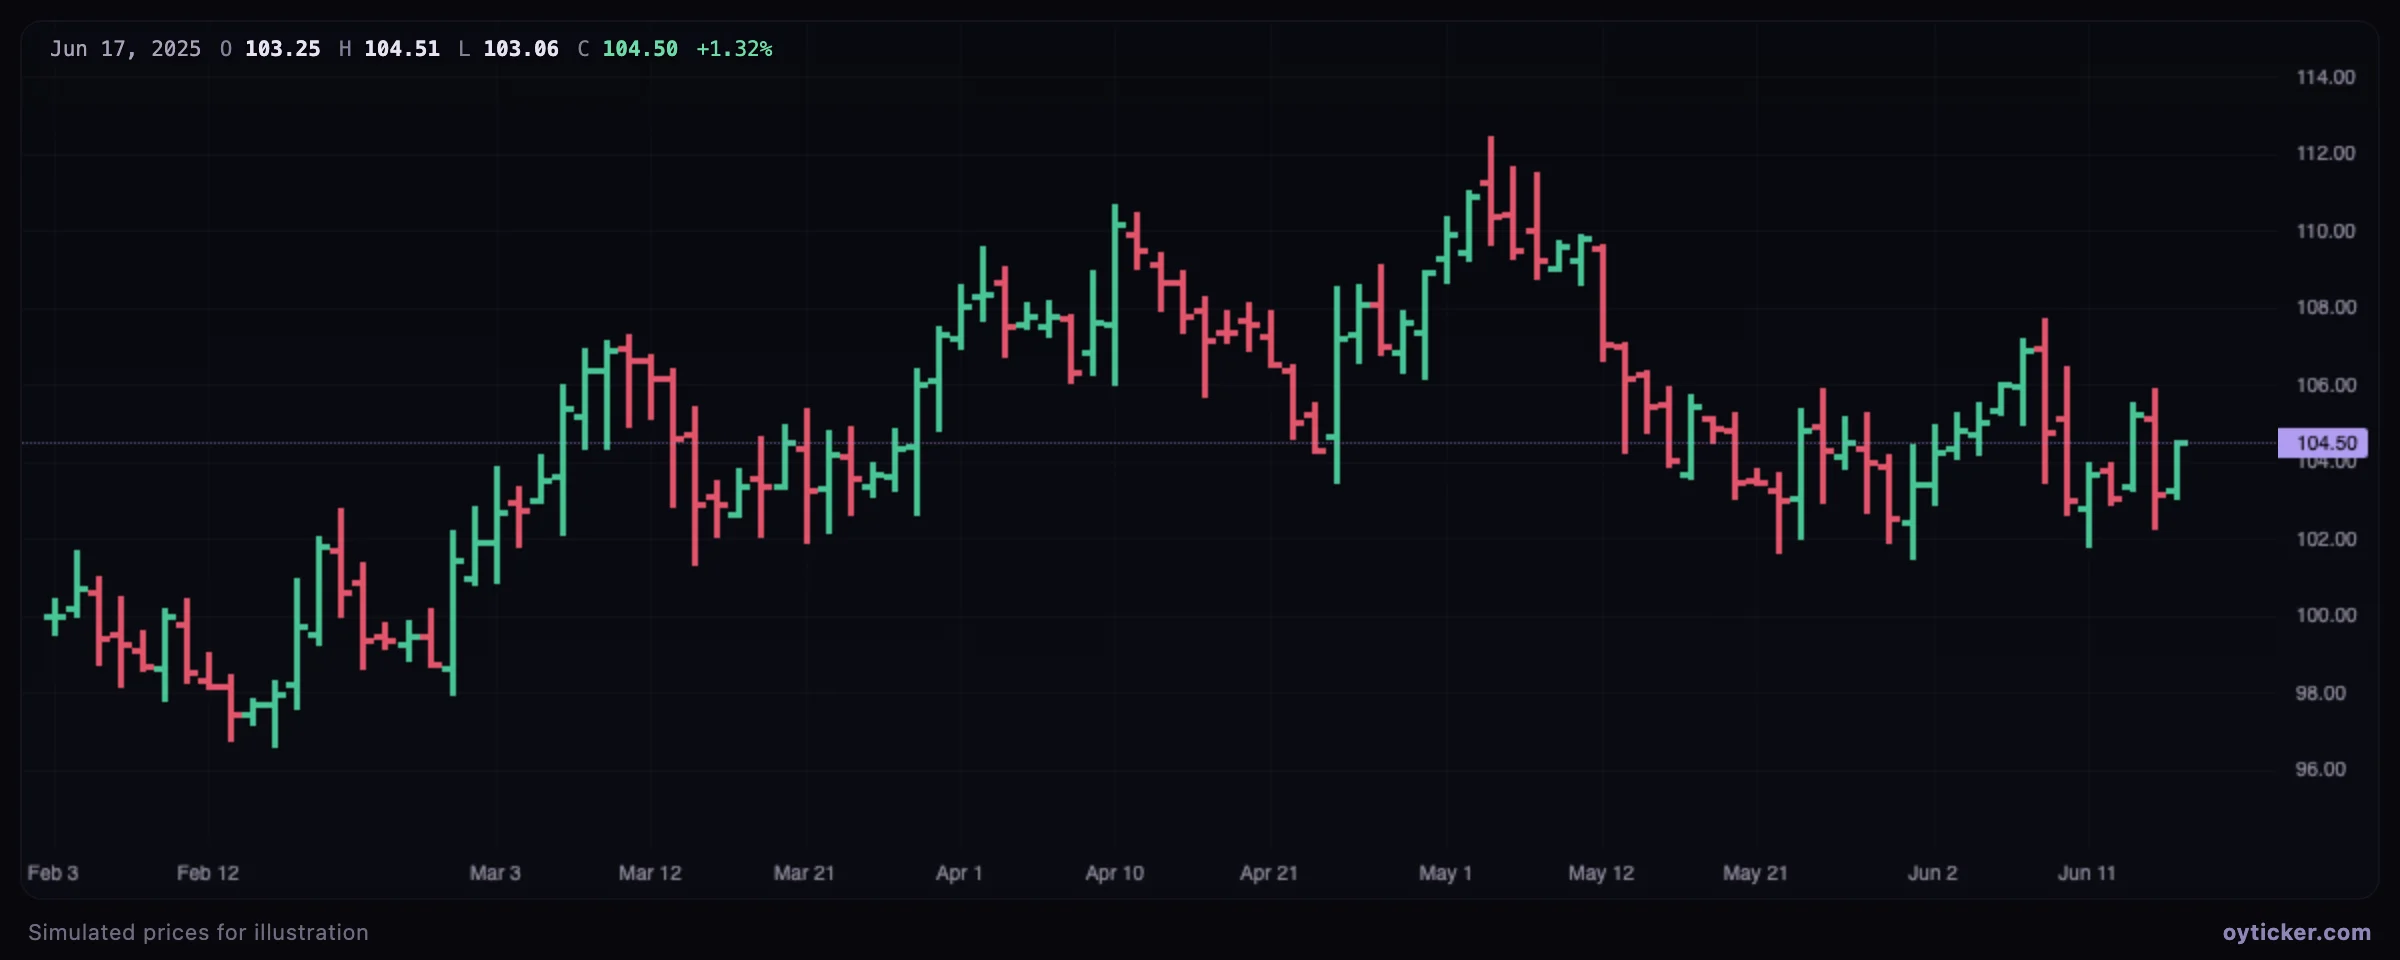
OHLC bars carry the same information as candles: a vertical line from the low to the high, a tick on the left for the open and on the right for the close.
- Show the same open, high, low and close as candles with less visual weight.
- Keep the chart readable when many drawings are on it.
Line
A line through the closing prices. It ignores the open, high and low and shows the cleanest picture of the trend.
- See the broad structure of the closes without the noise inside each bar.
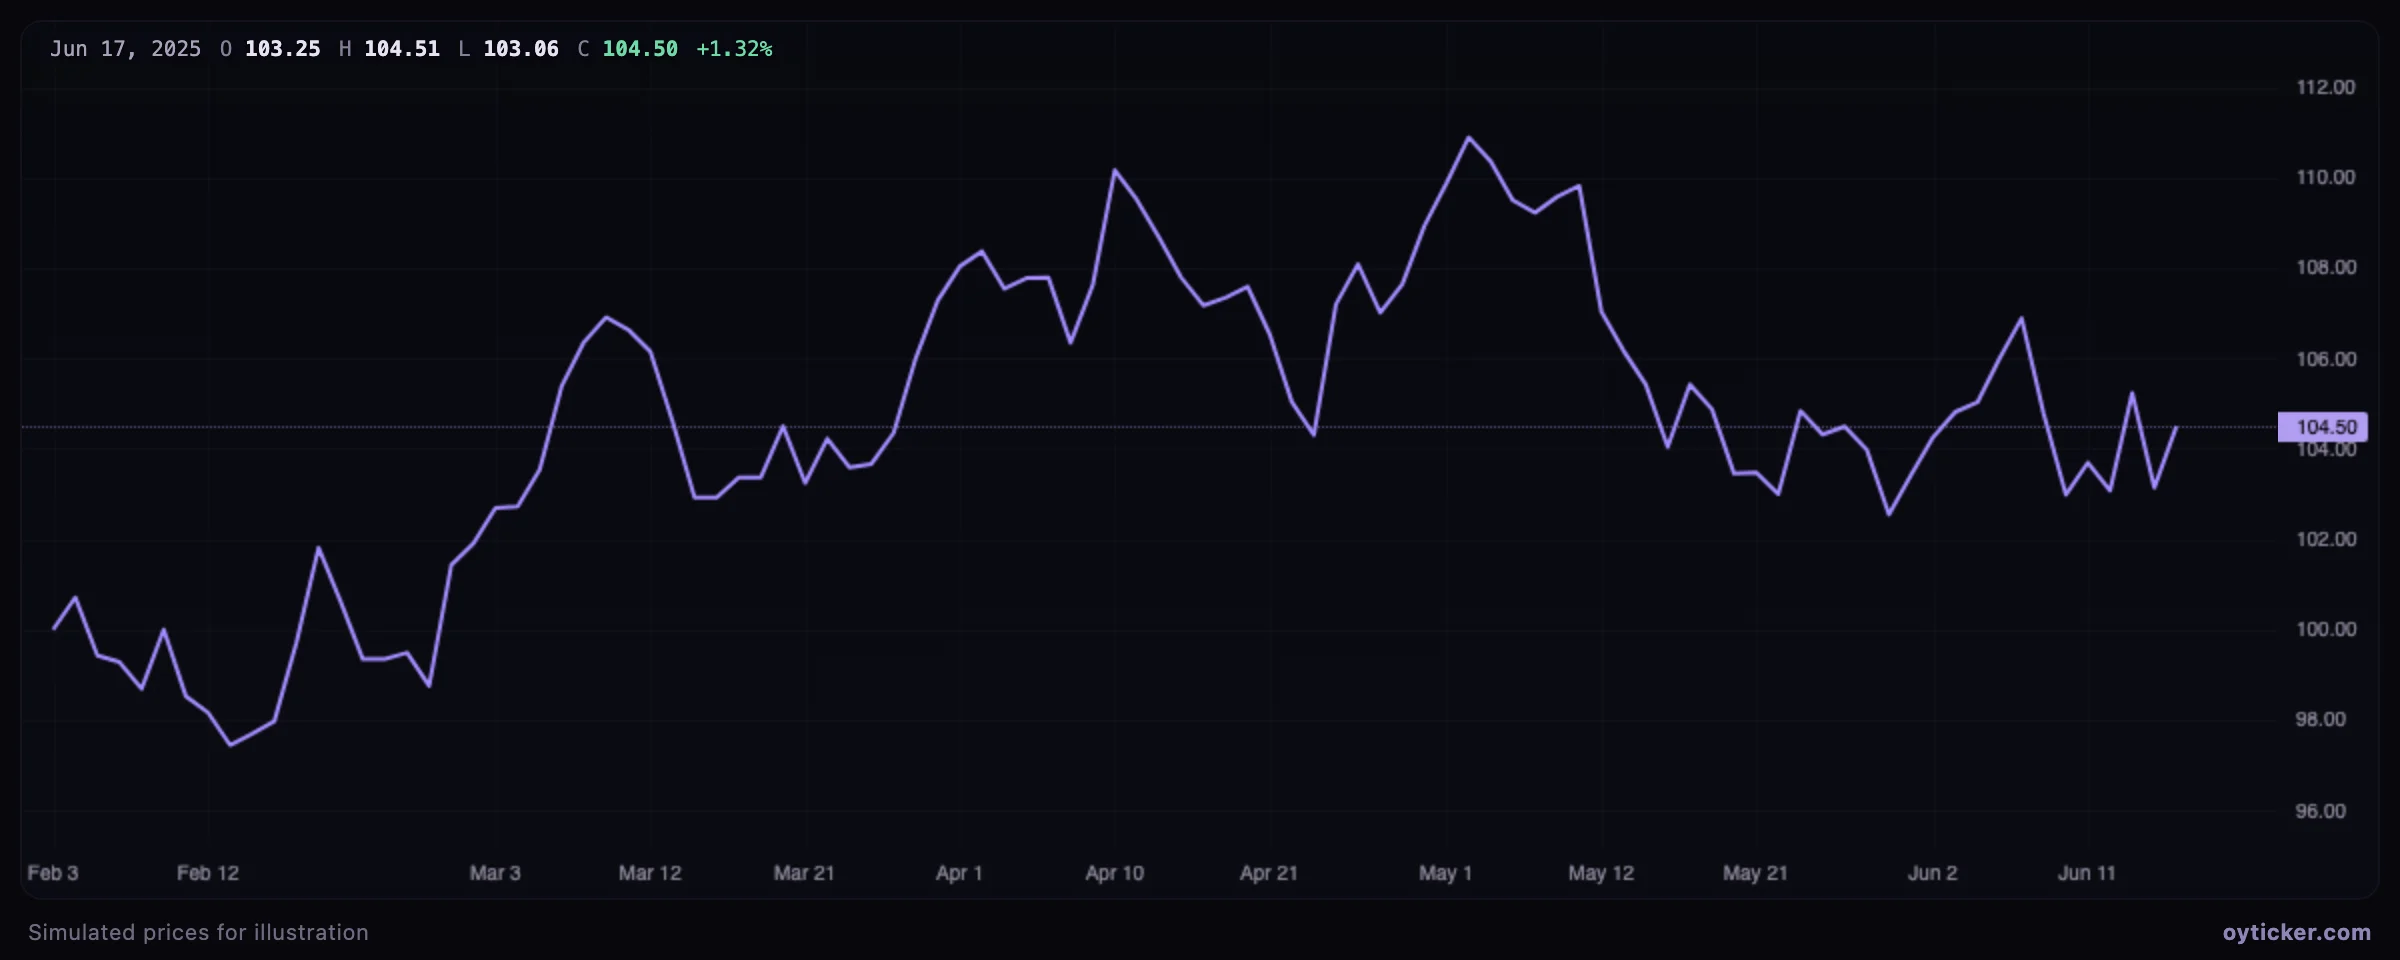
Use the line chart to read the broad structure; switch back to candles before placing levels, since a support defined by closes is not the same as one defined by lows.
Step line
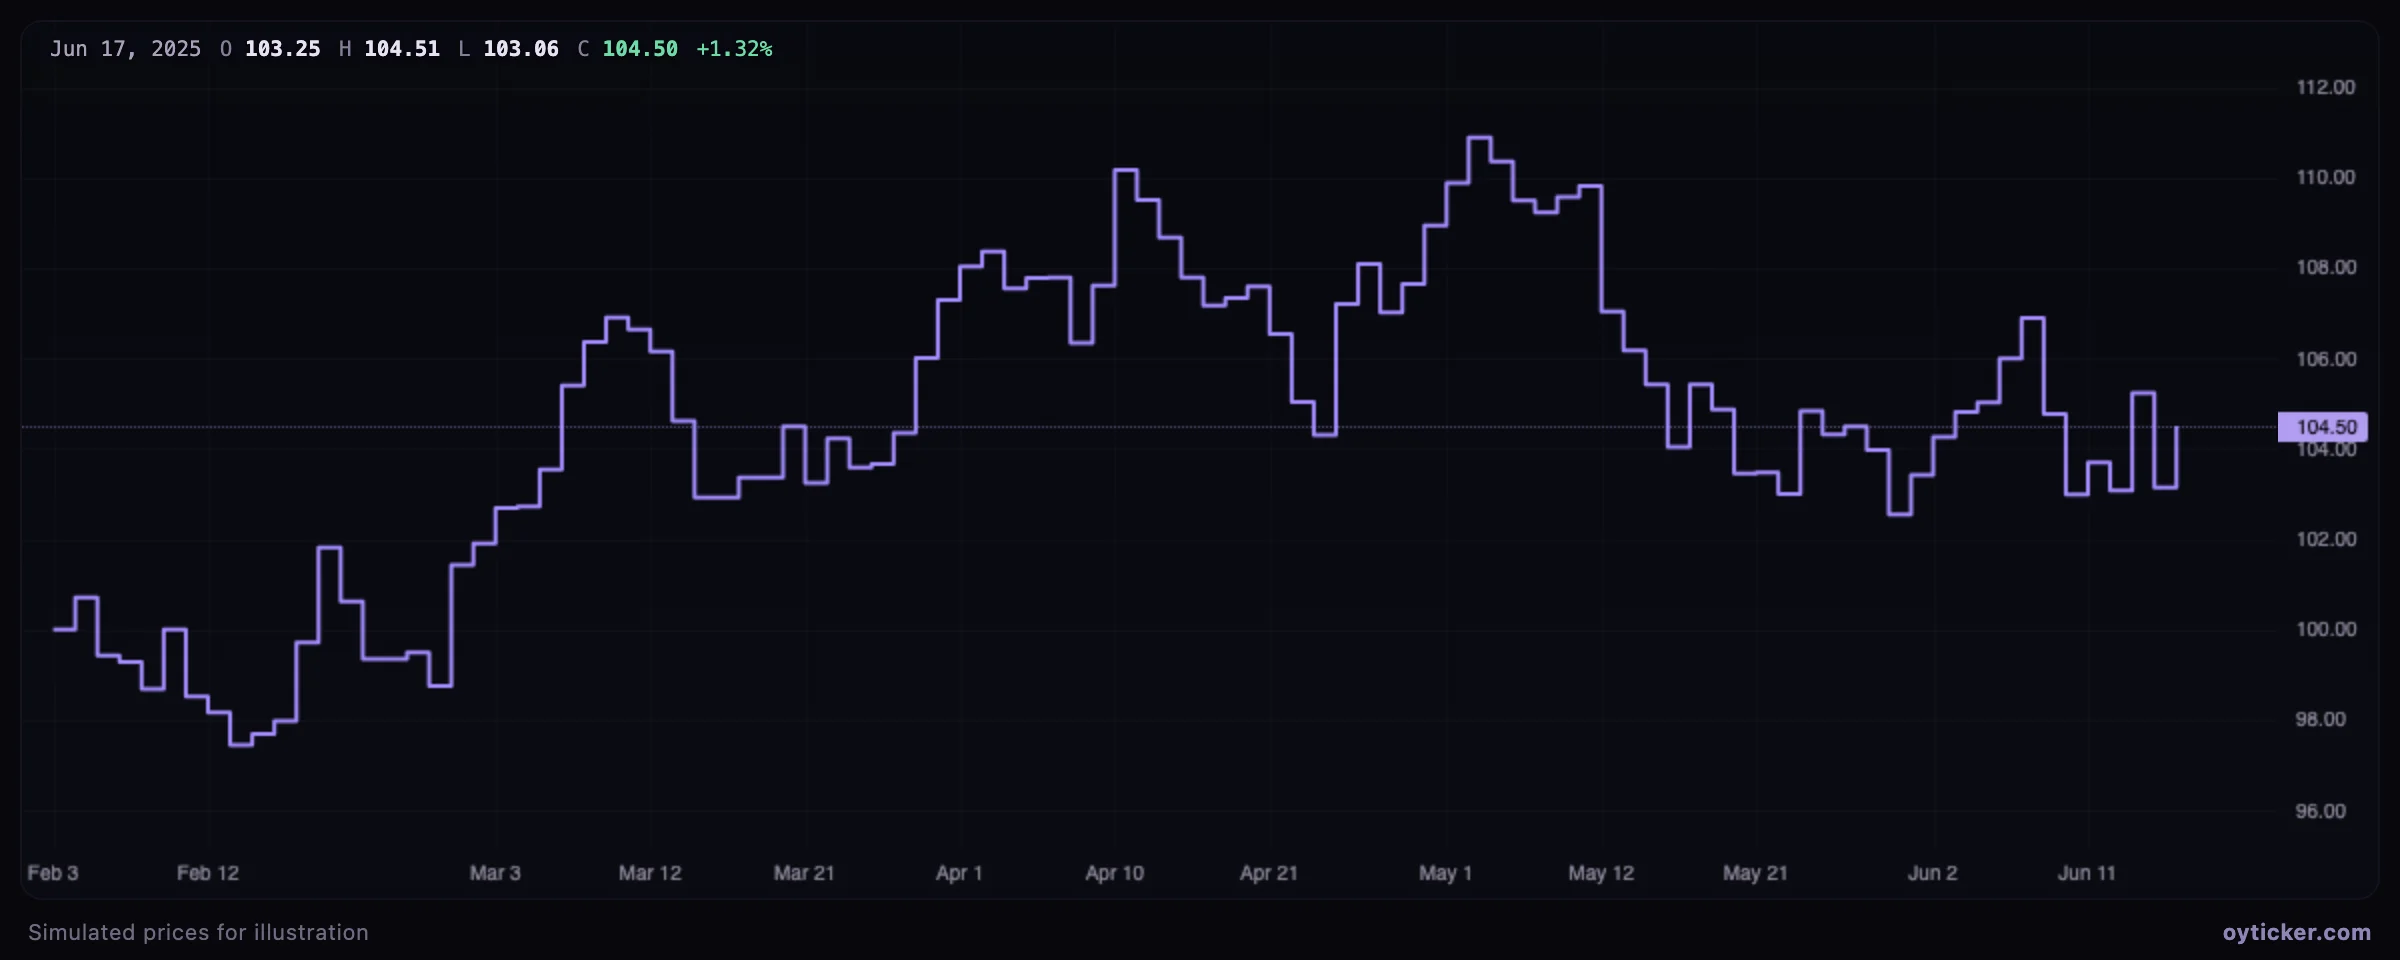
The closes drawn as steps: each close holds horizontally until the next bar. It makes the discrete nature of the data visible, useful for instruments that change price rarely.
- Show each close as a level held until the next one, which suits instruments whose price changes rarely.
Area
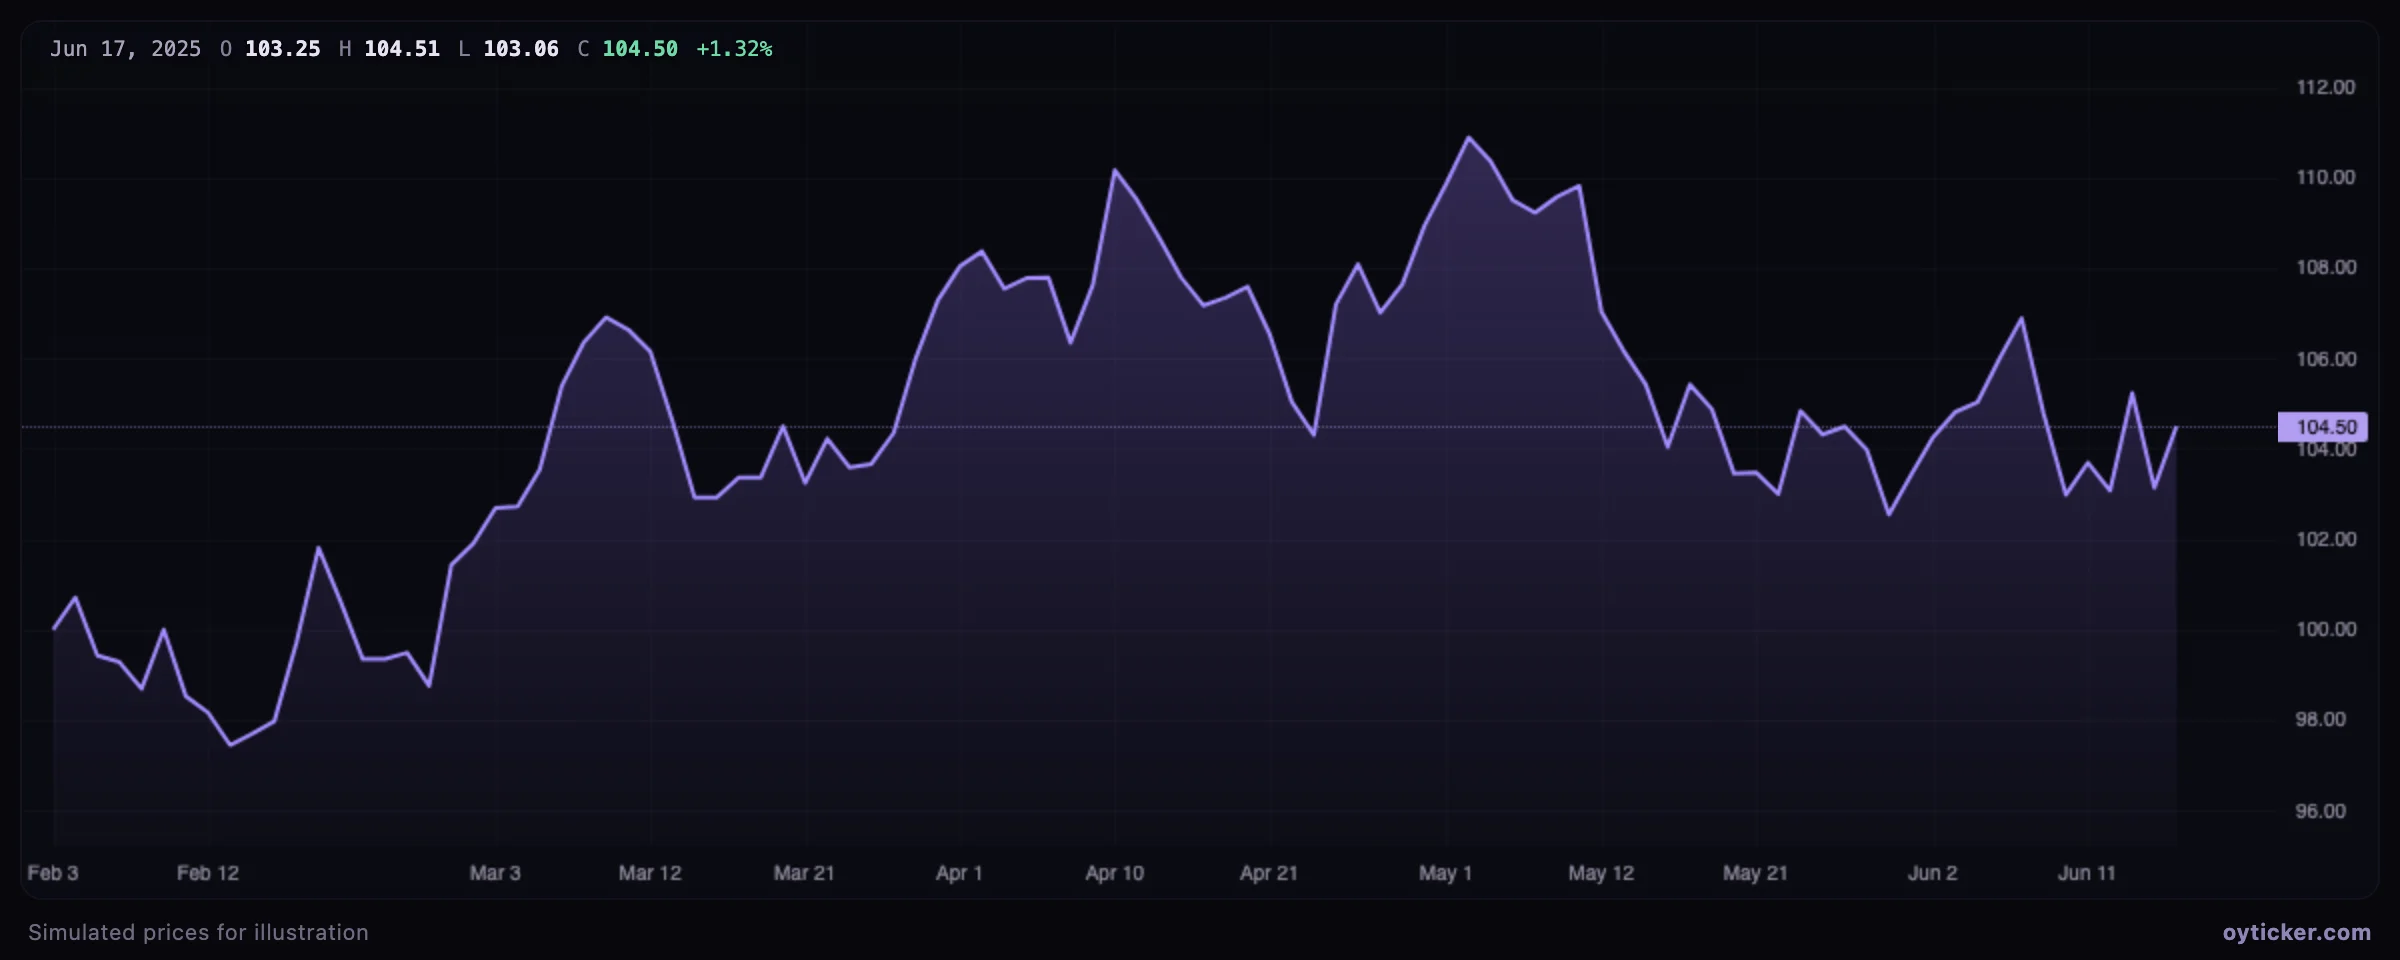
The line of closes with the area beneath it shaded. A presentation format, often used for long-term views and overviews.
- Present the trend of the closes with more visual weight, for overviews.
BaselinePlus
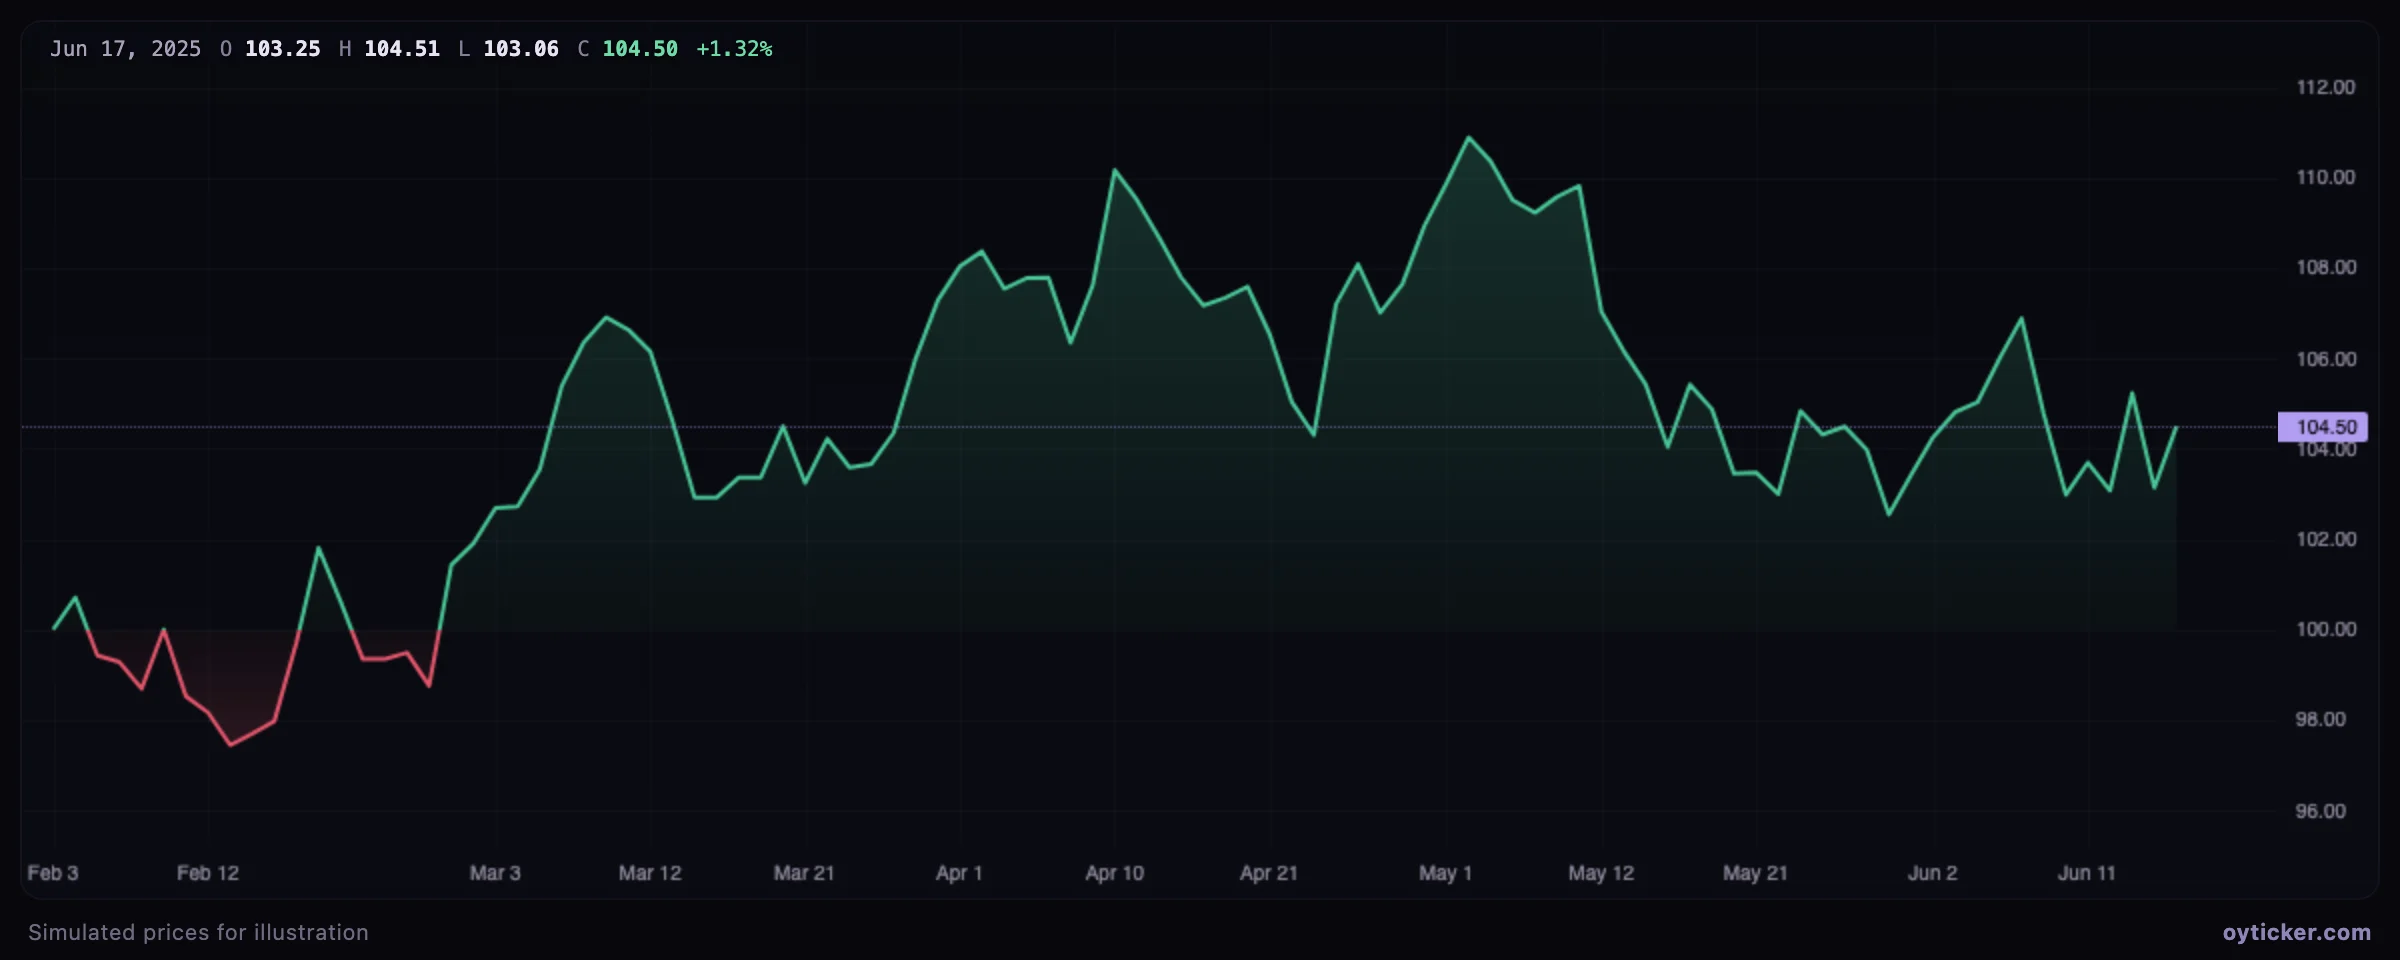
The line of closes colored green above a baseline and red below it. In Oyticker the baseline is the first close of the period shown, so the colors answer “is the price up or down over this period?”.
- See at a glance whether price is above or below the first close of the period shown.
RenkoPlus
Renko charts ignore time: a new brick is drawn only when the close moves a full box size beyond the last brick. Noise smaller than a box disappears, and trends show as staircases.
- Filter out moves smaller than one box and see trends as staircases.
- Spot reversals of at least two boxes, regardless of the time they take.
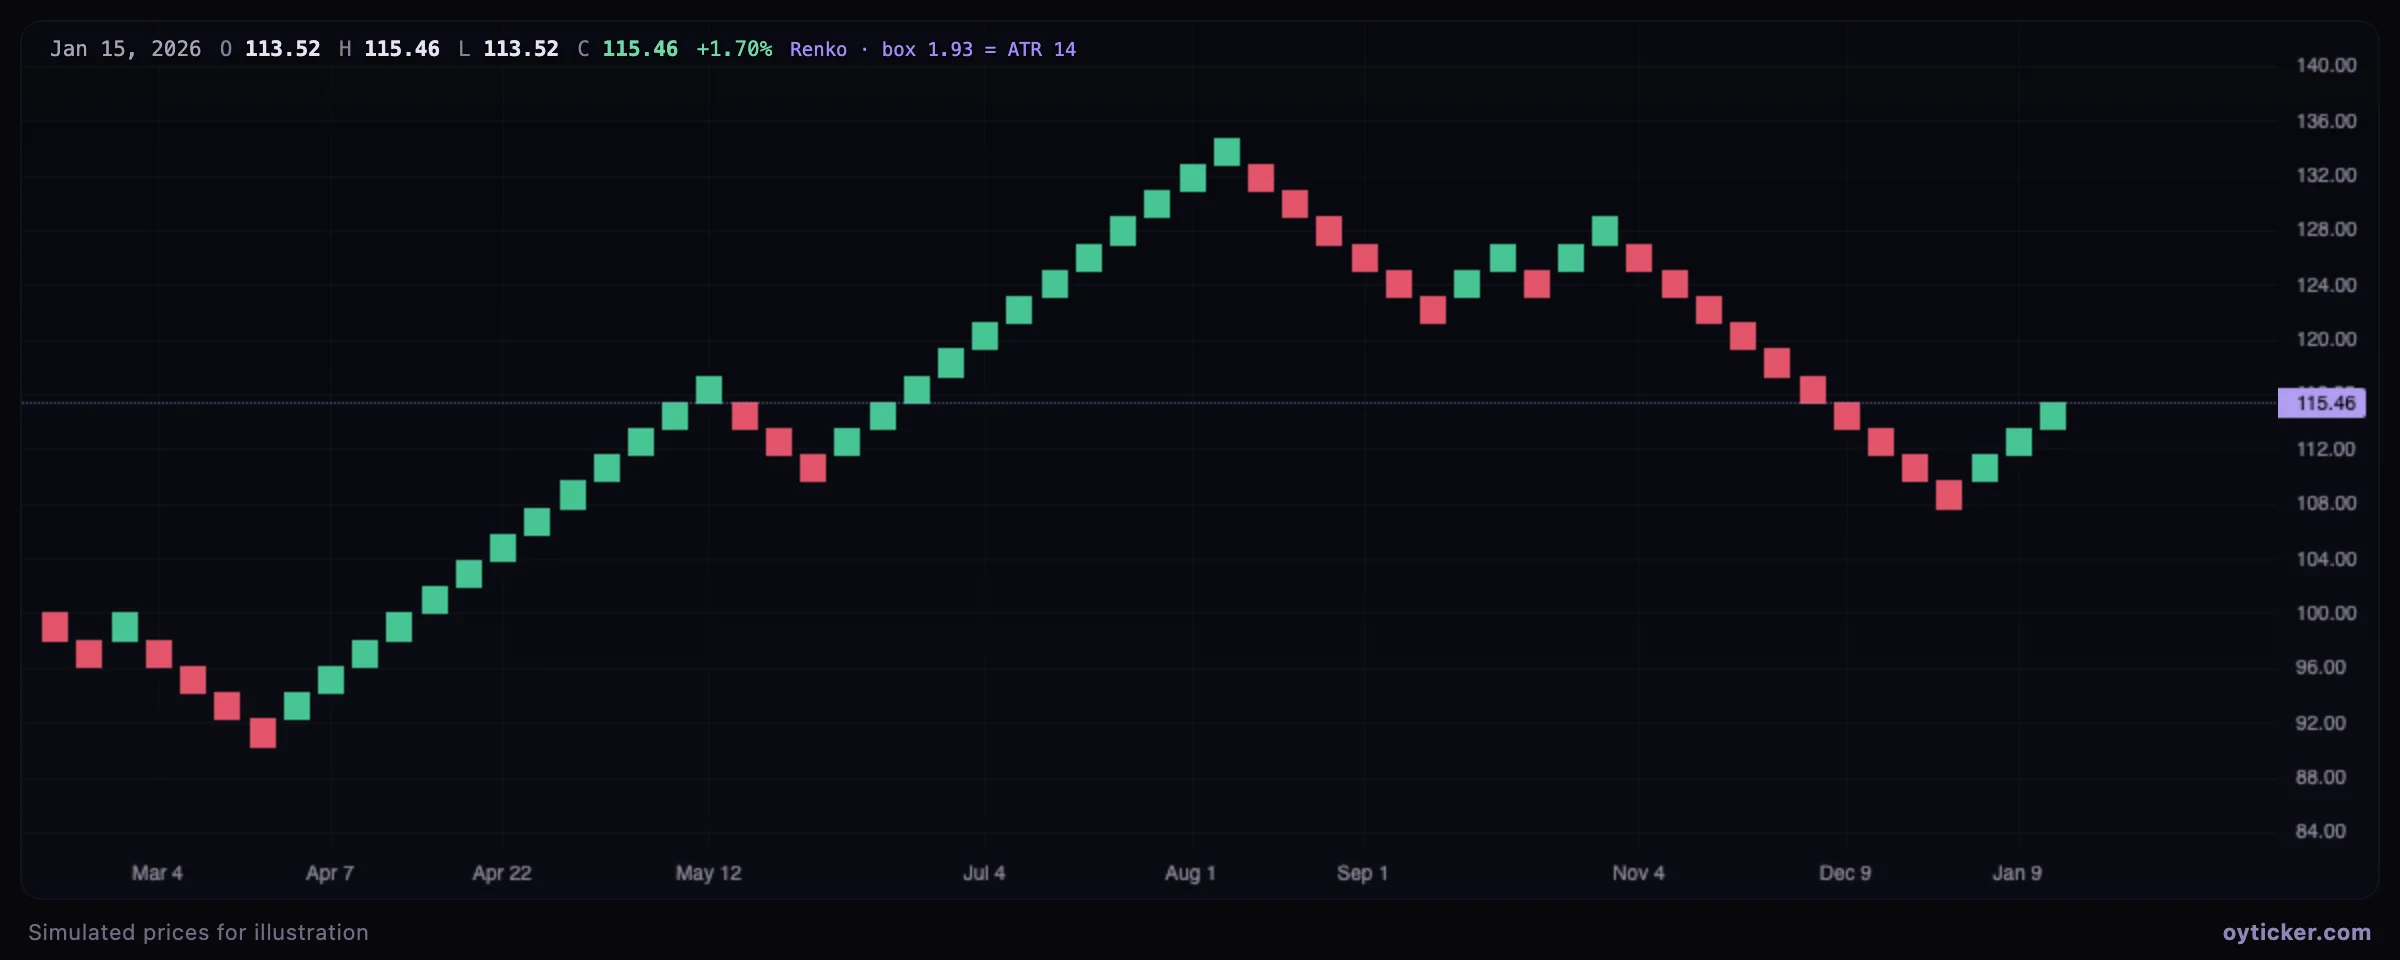
- Box size: the ATR(14) of the data, fixed for the whole chart, so bricks match the instrument's normal volatility.
- Construction (traditional, closes only): a new brick in the same direction when the close moves one box beyond the last brick; a reversal needs a move of two boxes (one box beyond the other end of the last brick).
- Time: each brick carries the time of the bar that completed it; several bricks from one bar are placed one second apart. Periods without bricks are invisible, so the time axis is not linear.
- Indicators are computed on the bricks in Renko mode, and the volume traded since the previous brick goes to the next brick.
Charts on this page use simulated prices generated for illustration. Educational content only, not investment advice.