Drawing tools · Shapes and text

Callout

A callout is a label connected to a precise point by a pointer. It explains a specific candle or level without covering it, which makes it the best tool for documenting a chart.

What it's for
  • Explain a precise candle or level with a label joined to it.
  • Document a chart for later review or for sharing.
Points
2: the point, then the label
Plan
Every plan
Text
Up to 280 characters, several lines
Edit
Double-click the label

Annotating a point

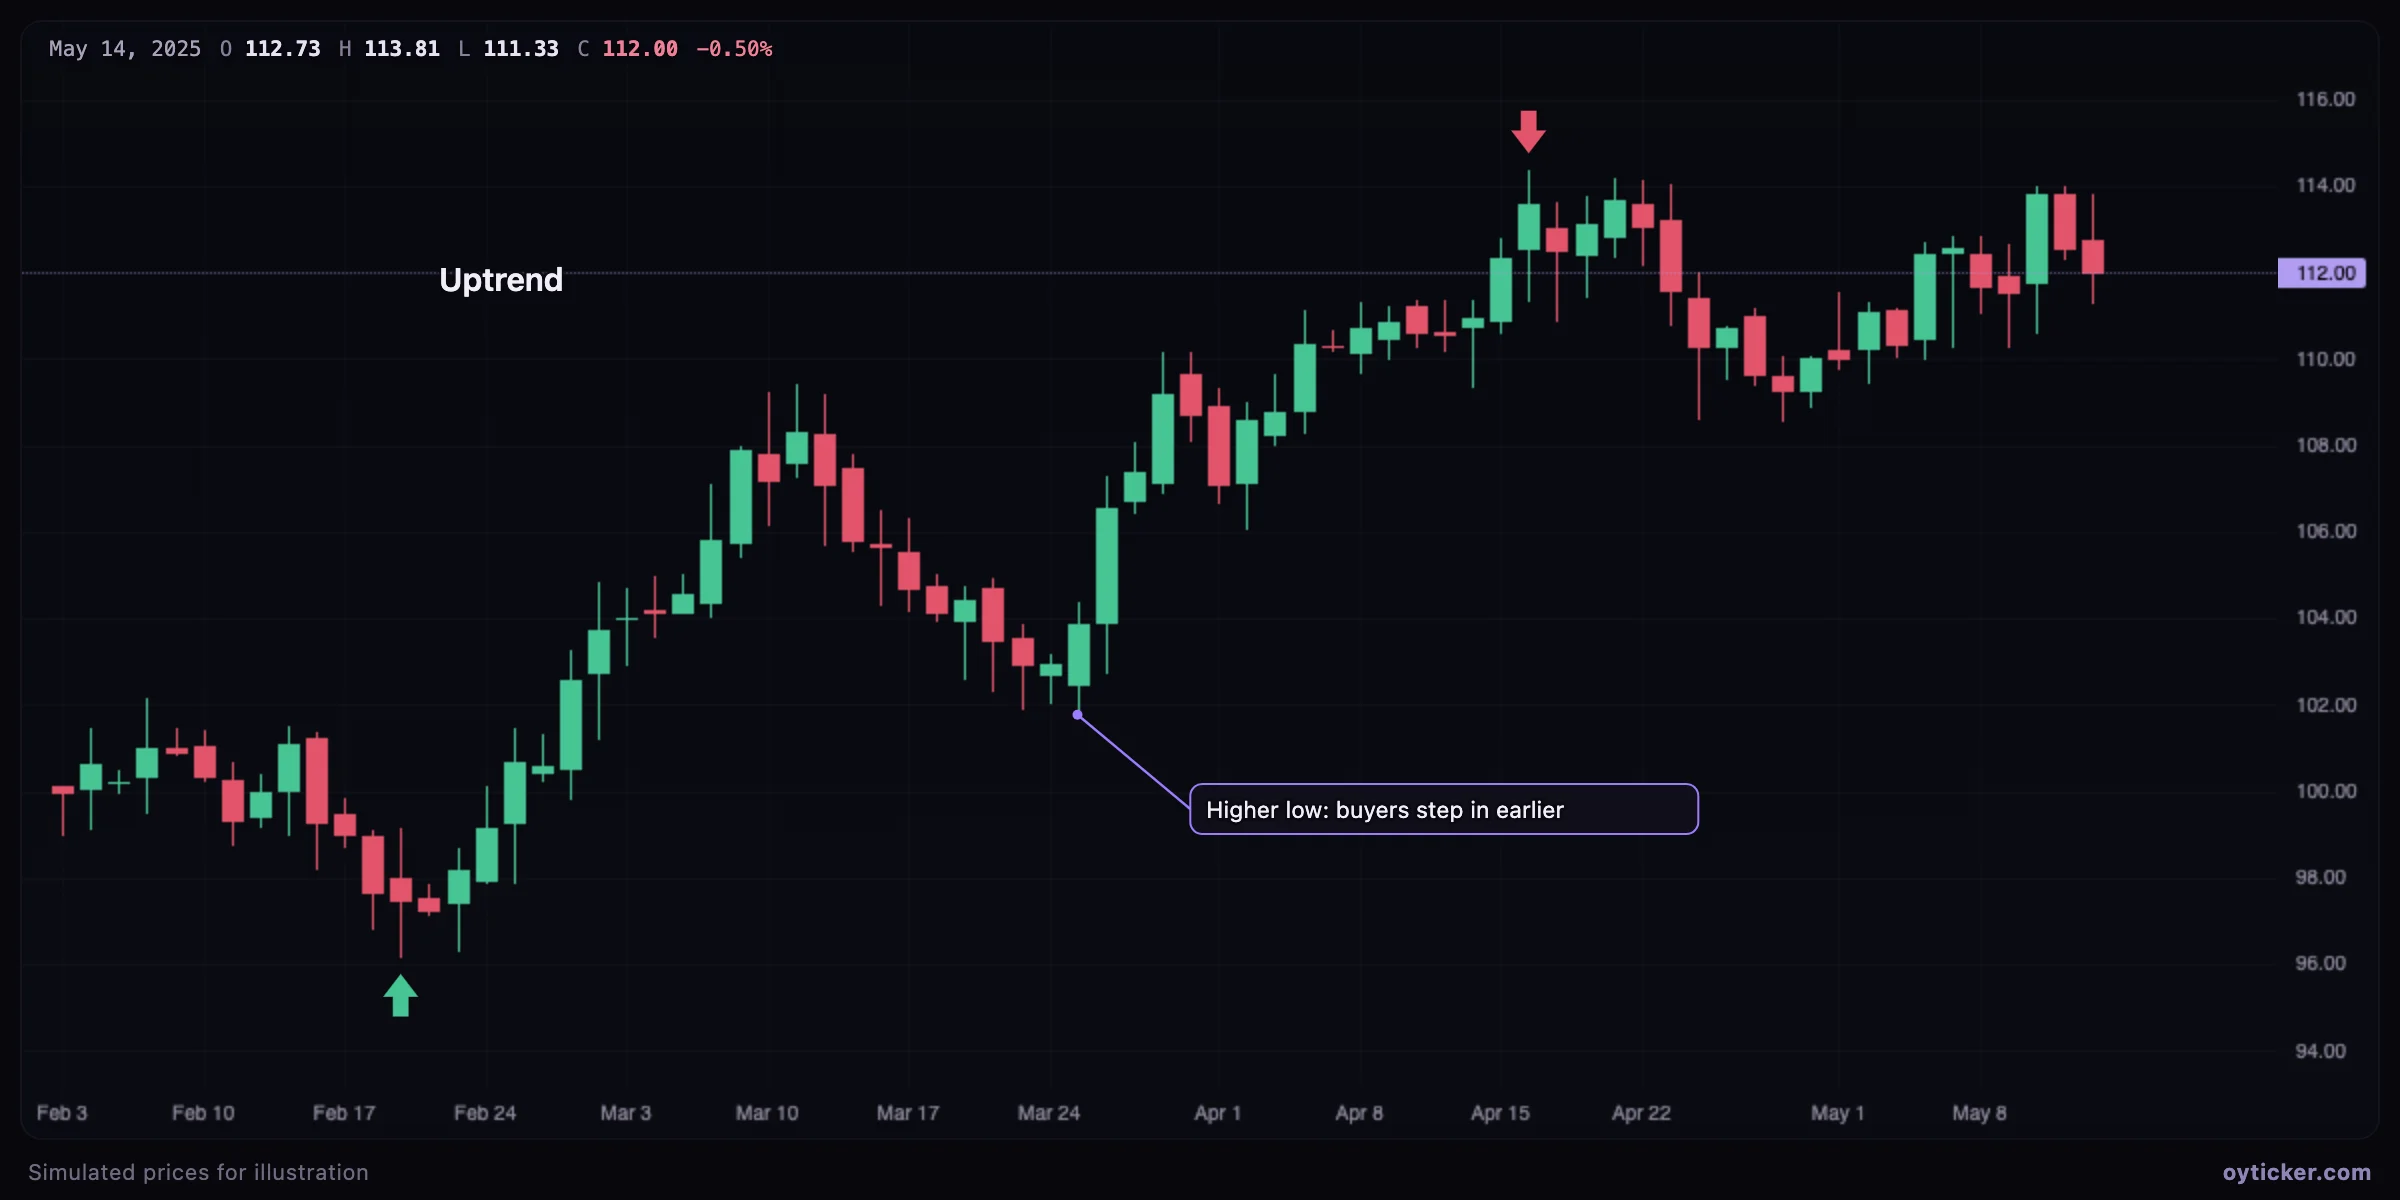
Chart annotated with a callout on a higher low, arrows on the low and the high, and a text label
A callout explains the higher low it points to; arrows mark the low and the high; a text label names the trend. Every annotation in these guides is drawn with these tools.
  1. Choose Shapes & text → Callout.
  2. Click the point to annotate, then where the label should sit, and type the text.
  3. The pointer always joins the side of the label facing the point; move the label anywhere without losing the link.

Charts in this guide use simulated prices generated for illustration; levels and outcomes shown are examples, not observations of a real market. Educational content only, not investment advice.

Callout tool: annotate a precise point of the chart | Oyticker