Drawing tools · Shapes and text

Rectangle

A rectangle marks an area in price and time. It is the natural tool for zones: supply and demand areas, consolidation ranges, gaps, or the period of an event, where a single line would suggest false precision.

What it's for
  • Mark price zones (supply, demand, ranges, gaps) rather than single lines.
  • Highlight a period on the chart.
Points
2 opposite corners
Plan
Every plan
Style
Color, width, dash; translucent fill
Typical use
Zones, ranges, gaps

Marking a zone

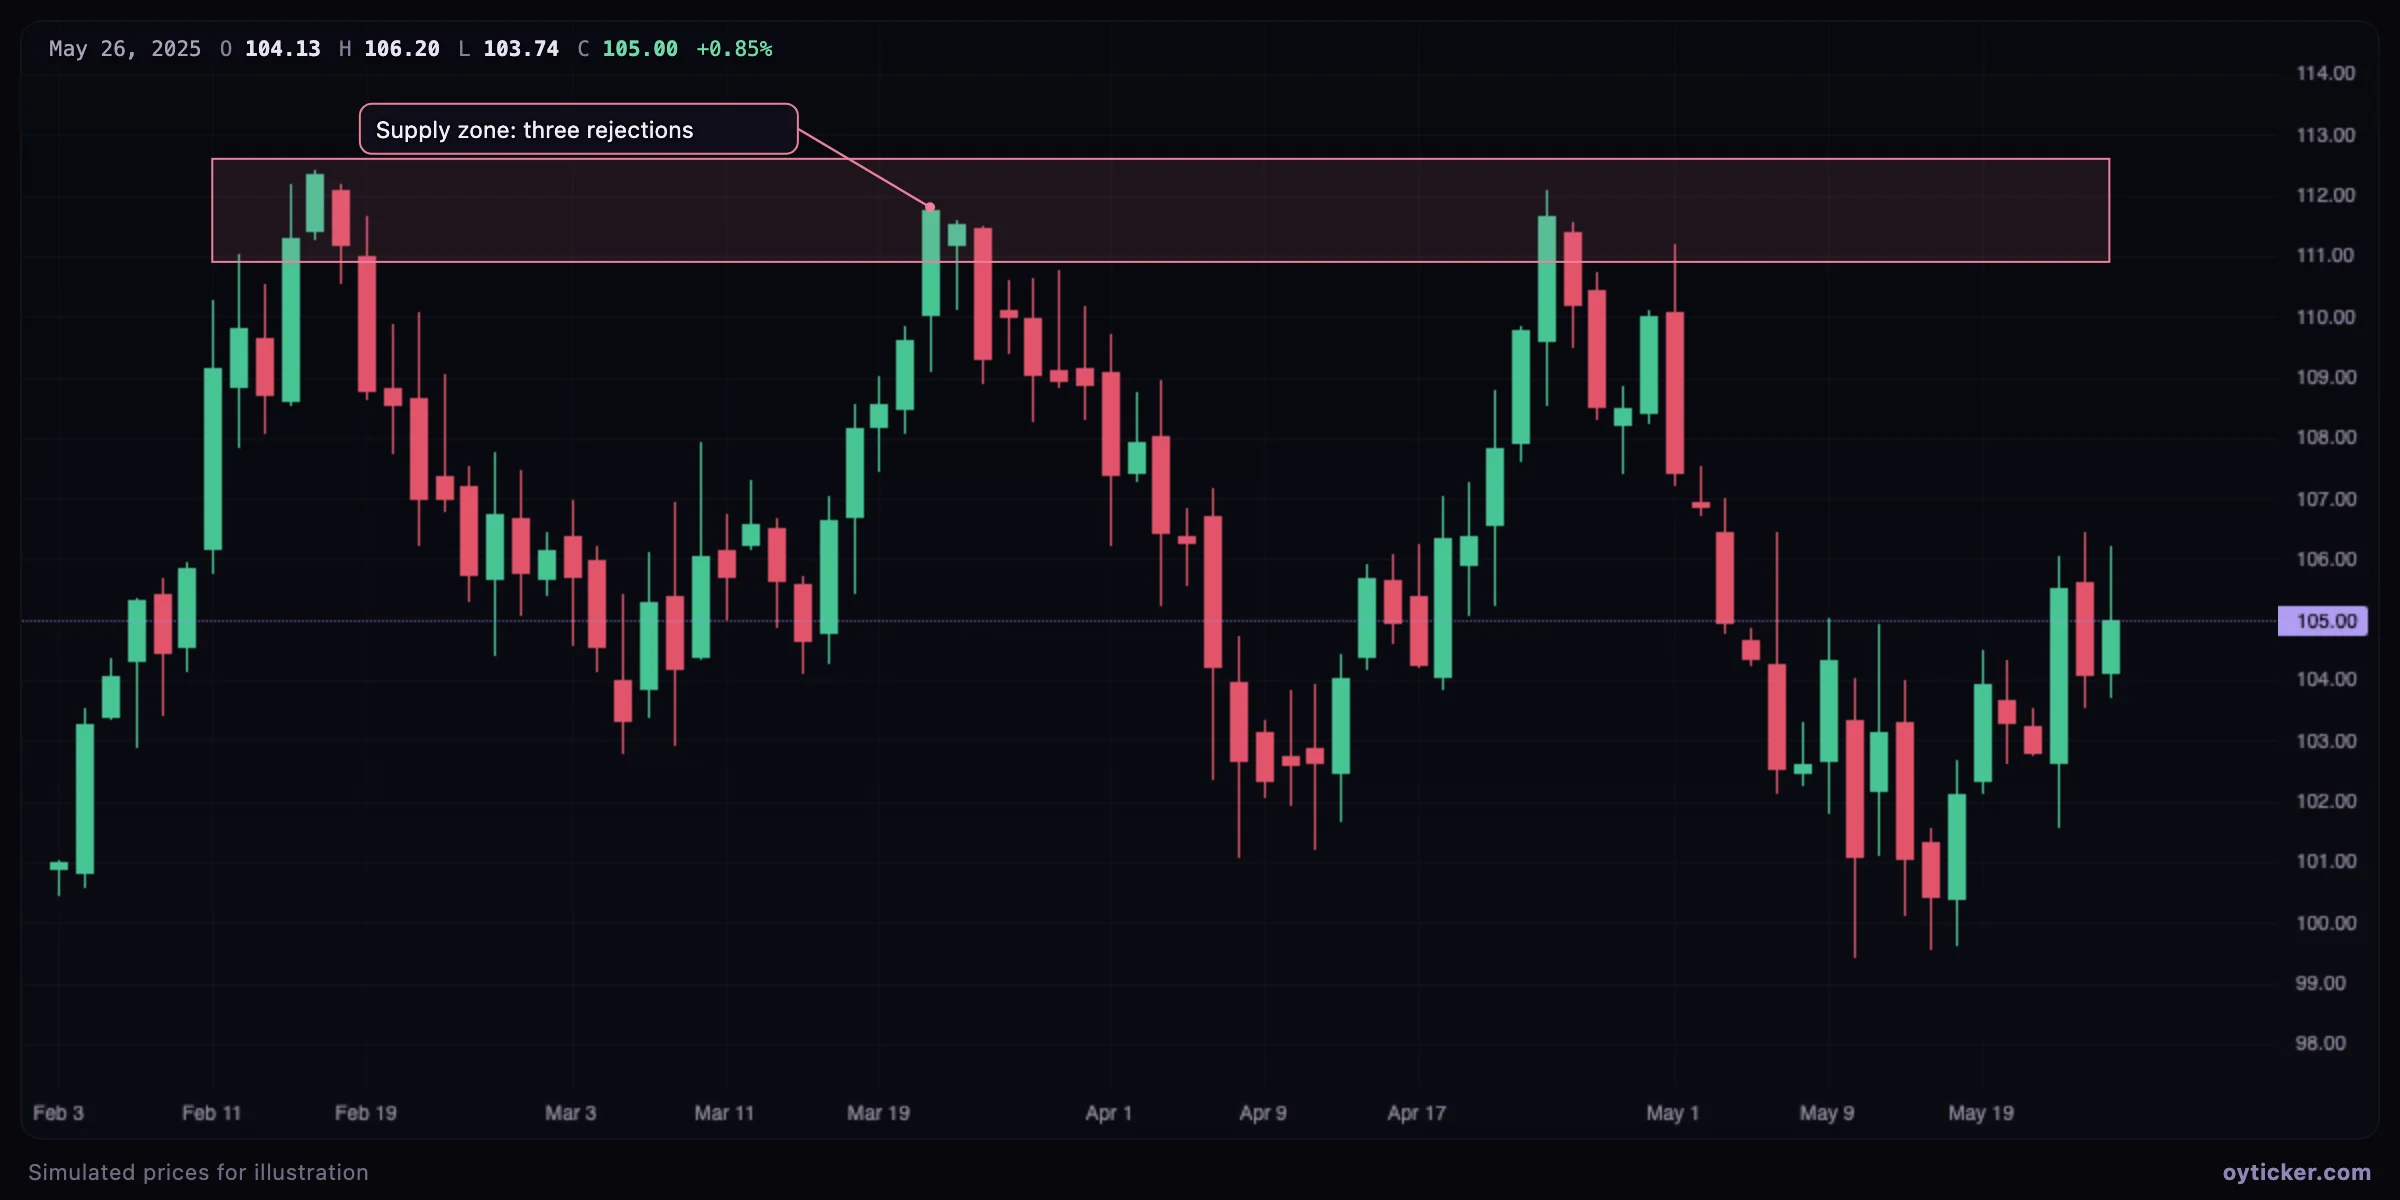
Rectangle marking a supply zone between about 110.9 and 112.6 with three rejections
Three advances are rejected between about 110.9 and 112.6. A rectangle from the first rejection to the right edge shows the zone better than a line at any single price.

Draw the zone from the extreme wicks to the bodies of the rejection candles: the wicks show how far buyers pushed, the bodies where sellers regained control. Extend the right corner into the future to keep the zone visible.

How to draw it

  1. Choose Shapes & text → Rectangle.
  2. Click one corner, then the opposite corner (or press and drag).
  3. Change the color to code zones (for example red for supply, green for demand) and lock it once placed.

Charts in this guide use simulated prices generated for illustration; levels and outcomes shown are examples, not observations of a real market. Educational content only, not investment advice.

Rectangle tool: mark supply and demand zones and ranges | Oyticker