
Labeling a chart
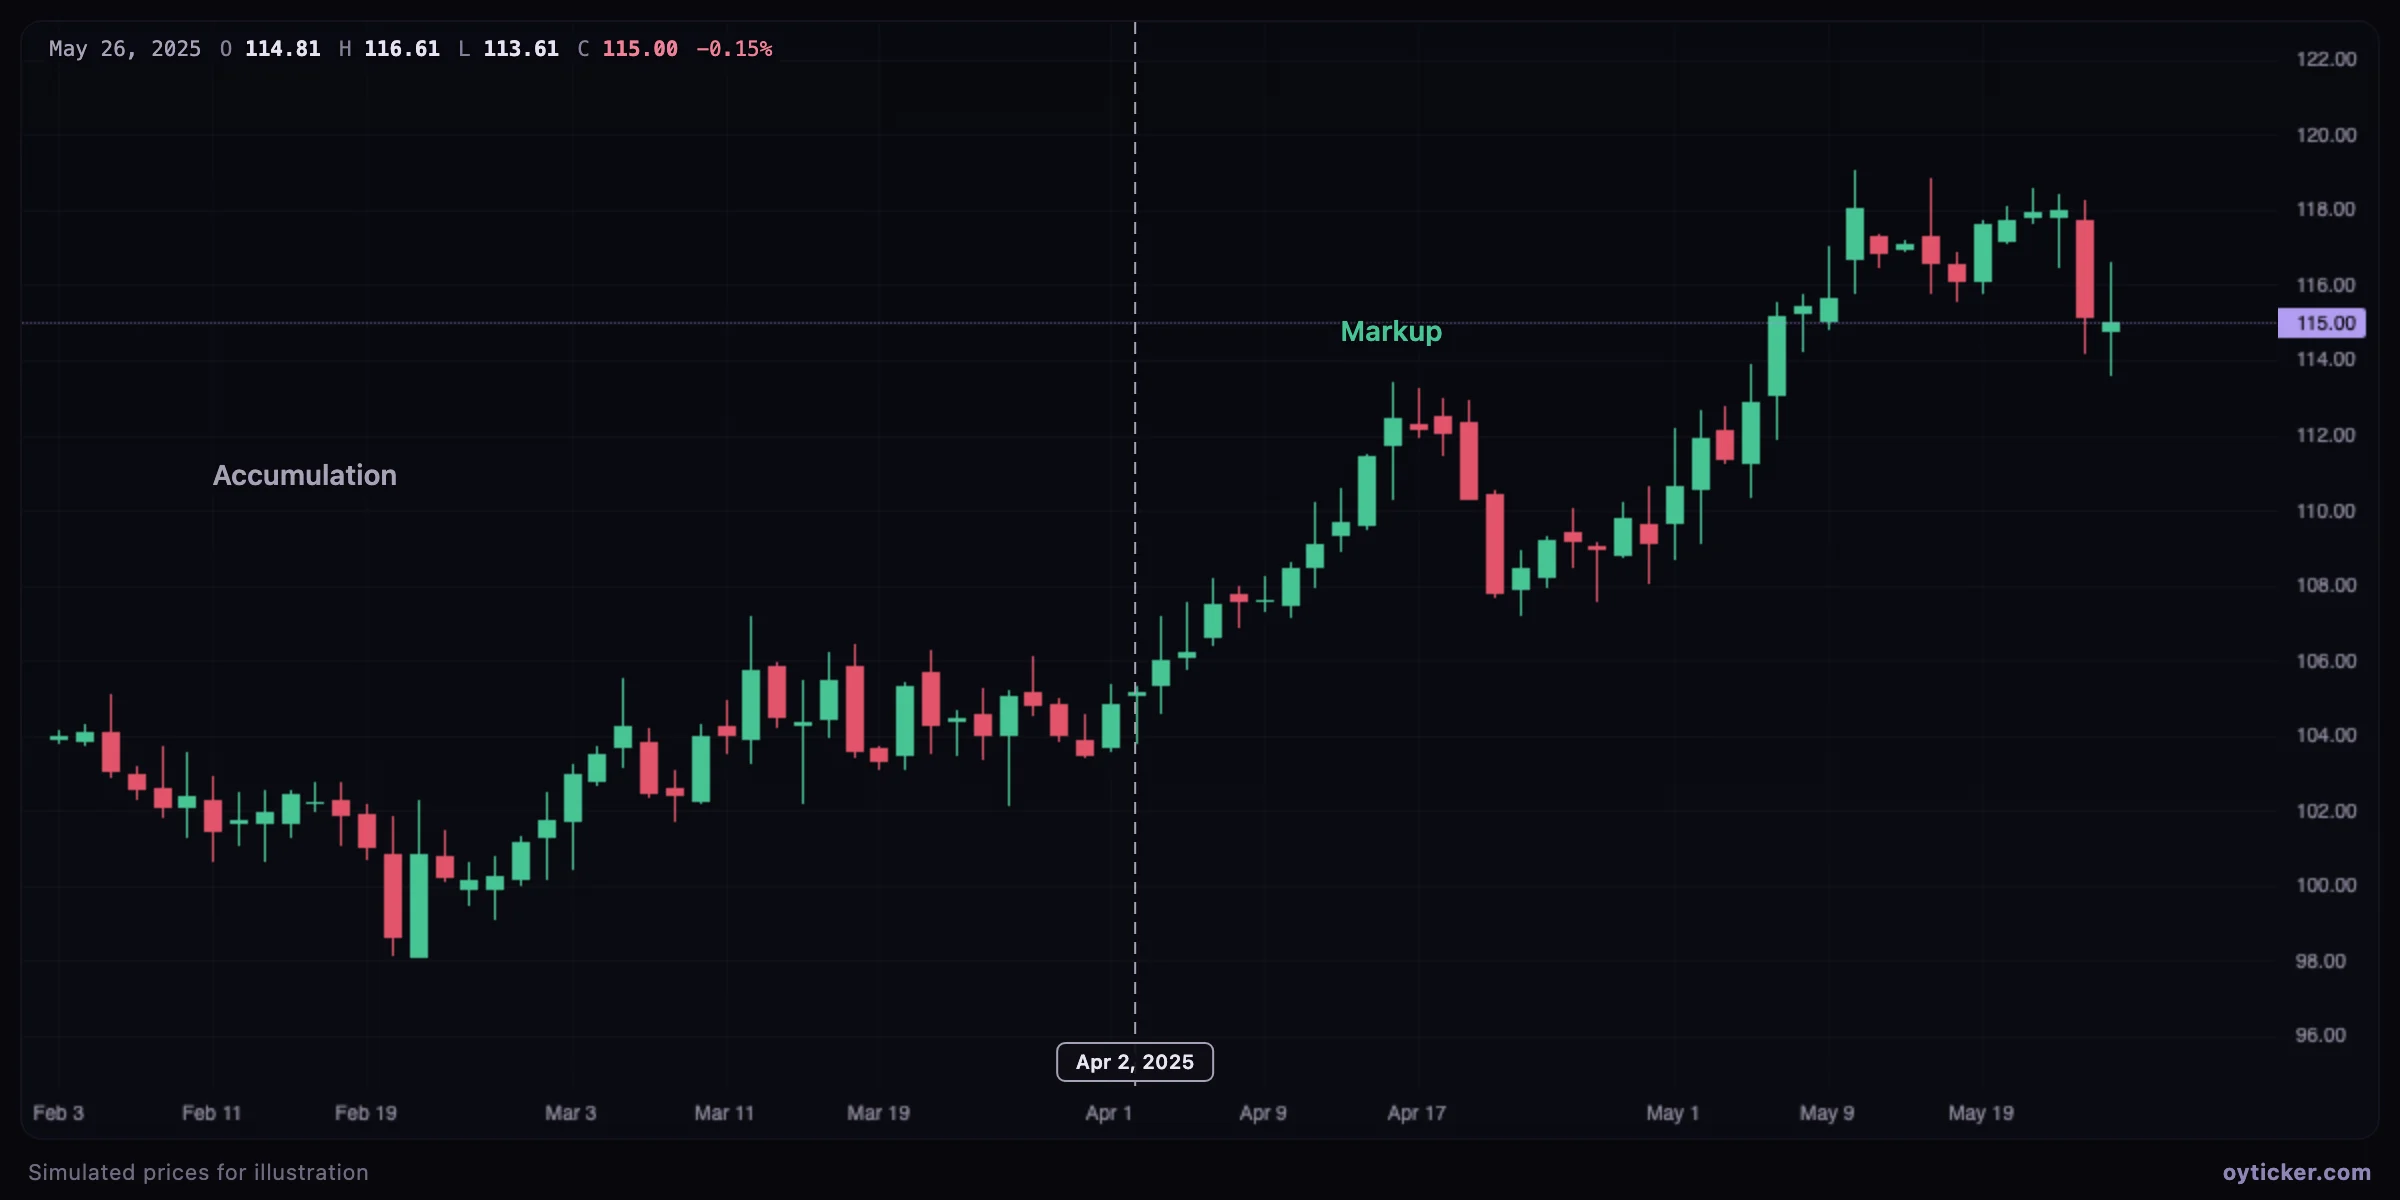
- Choose Shapes & text → Text and click where the text should start.
- Type, then press Enter (Shift+Enter adds a line). Escape cancels; an empty text is removed.
- Double-click the text later to edit it; choose its size and color in the options.
Charts in this guide use simulated prices generated for illustration; levels and outcomes shown are examples, not observations of a real market. Educational content only, not investment advice.