
What it is for
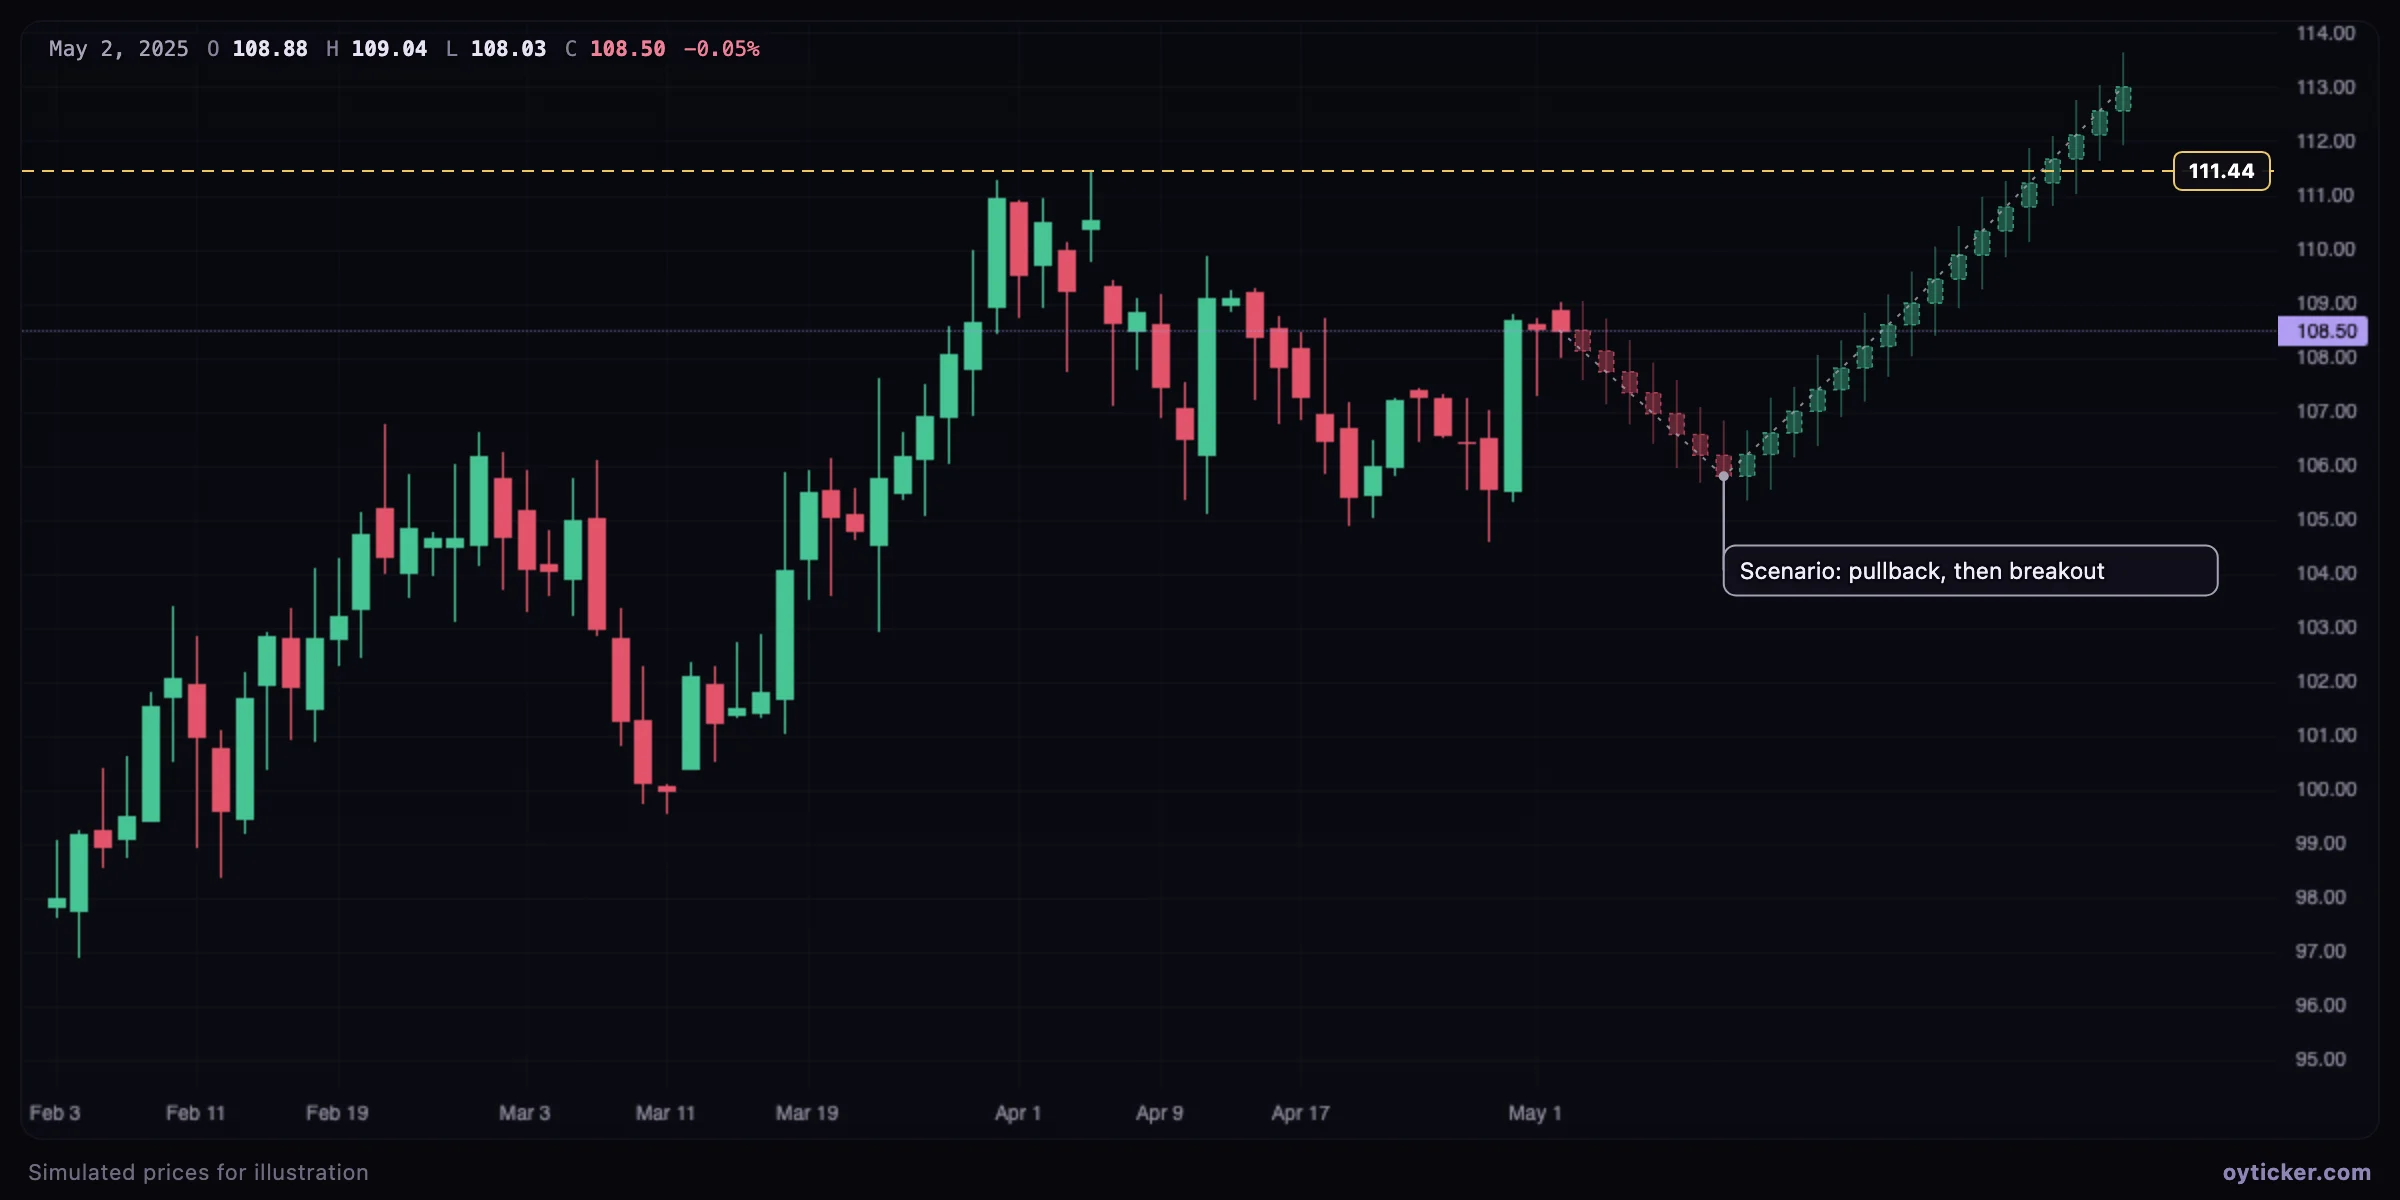
- Planning: where would you act if the scenario unfolds, and what would prove it wrong?
- Discipline: comparing the ghost path with the real one after the fact shows whether your expectations about timing and amplitude are realistic.
- Communication: a scenario is easier to discuss than a description.
How to draw it
- Choose Projection & measure → Ghost feed.
- Click the starting point (usually the last candle), then each turning point of the scenario, moving to the right. A click on or before the bar of the previous point is ignored.
- Finish with a double-click, the Enter key, or the Finish button.
Each ghost candle opens at the previous ghost close and closes on the path; its wicks are sized from the average range of the last 20 real candles, so the scenario has a realistic texture. These candles are illustrations, not data: no indicator uses them.
Limits
A scenario is a hypothesis. Draw at least the alternative you would act on if the first one fails, and decide in advance what invalidates each.
Charts in this guide use simulated prices generated for illustration; levels and outcomes shown are examples, not observations of a real market. Educational content only, not investment advice.