
Construction
A is the start of the swing, B its end, C the end of the pullback. Each level is placed at C + k × (B − A): level 0 is C itself, level 1 is where the move from C equals the move from A to B (the classic measured move, also the AB=CD completion), 1.618 is a golden-ratio extension.
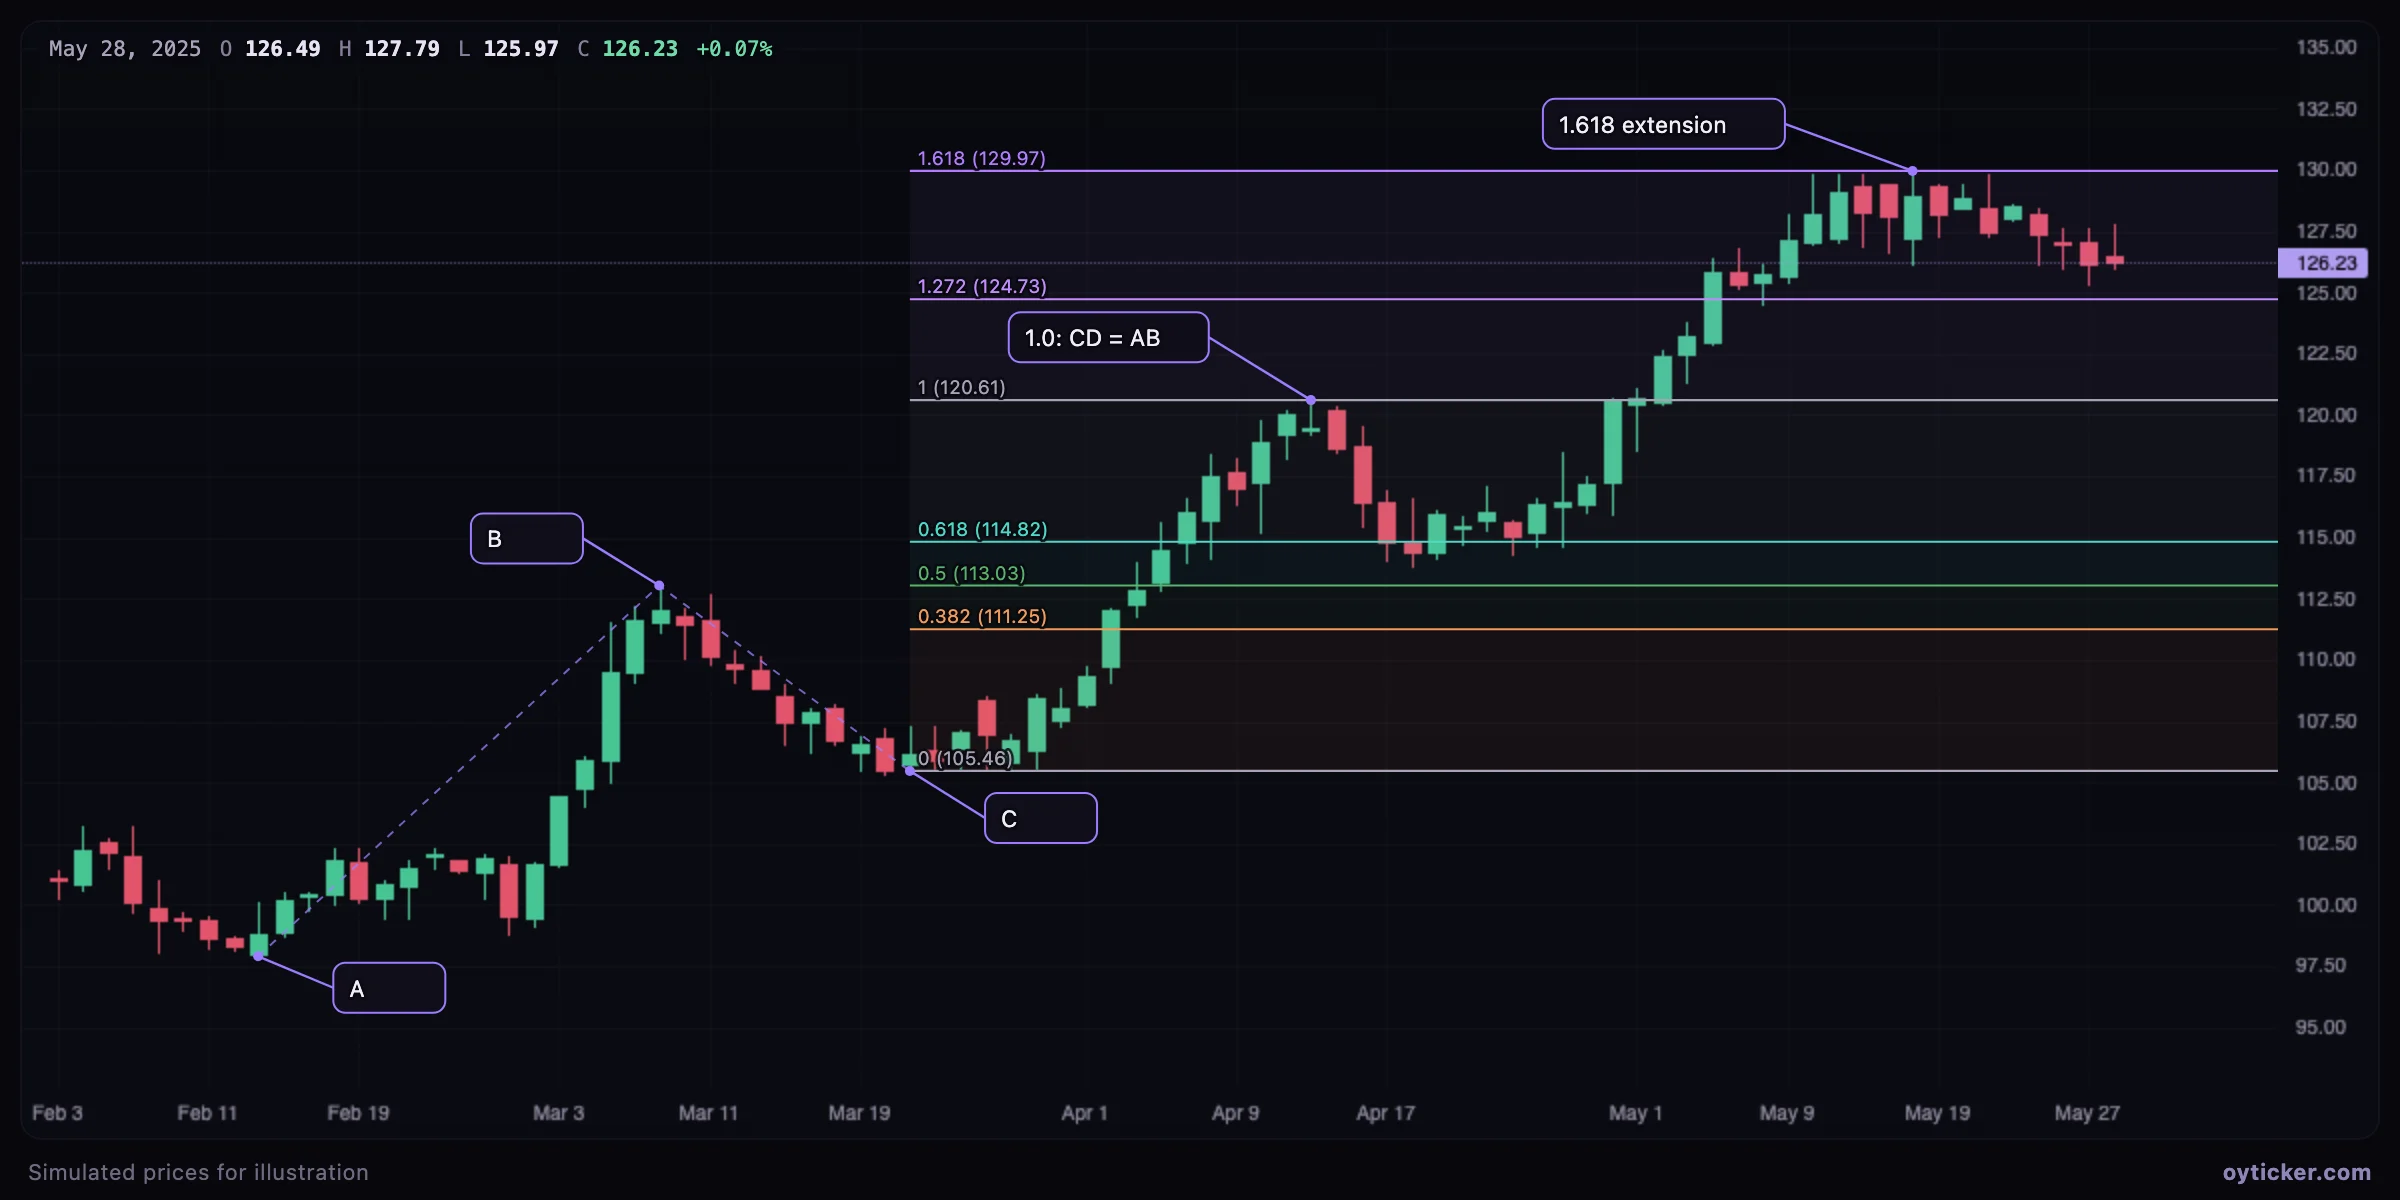
How to draw it
- Choose Fibonacci → Trend-based fib extension.
- Click A (start of the swing), B (end of the swing), then C (end of the pullback). Press and drag sets A and B in one gesture.
- Tick Extend right to keep the levels visible until the targets are reached, and 2–4.236 to add the far levels.
How to read it
- 0.618 and 1.0 are the usual first targets: many legs stop around the length of the previous one.
- 1.272 and 1.618 are typical of strong, accelerating trends; a move that reaches 1.618 quickly is usually extended and prone to a pause.
- Use levels as areas to manage a position (take partial profits, tighten a stop) rather than as places to reverse blindly.
- The depth of C matters: a shallow C (23.6–38.2% of A–B) shows a strong trend in which extended targets are more likely.
Limits
- A projection is a hypothesis about symmetry between swings, not a forecast.
- If C is beyond A (the pullback retraced more than 100%), the structure is broken and the projection has no meaning.
Charts in this guide use simulated prices generated for illustration; levels and outcomes shown are examples, not observations of a real market. Educational content only, not investment advice.