Drawing tools · Projection

Date range

The date range tool measures time between two points: the number of bars, the calendar duration and the total volume traded. It is used to compare the length of consolidations, trends and cycles.

What it's for
  • Count the bars, the calendar duration and the volume between two dates.
  • Compare the length of consolidations, pullbacks and cycles.
Points
2
Plan
Every plan
Shows
Bars, duration, volume
Typical use
Consolidations, cycles, time symmetry

Example: the length of a consolidation
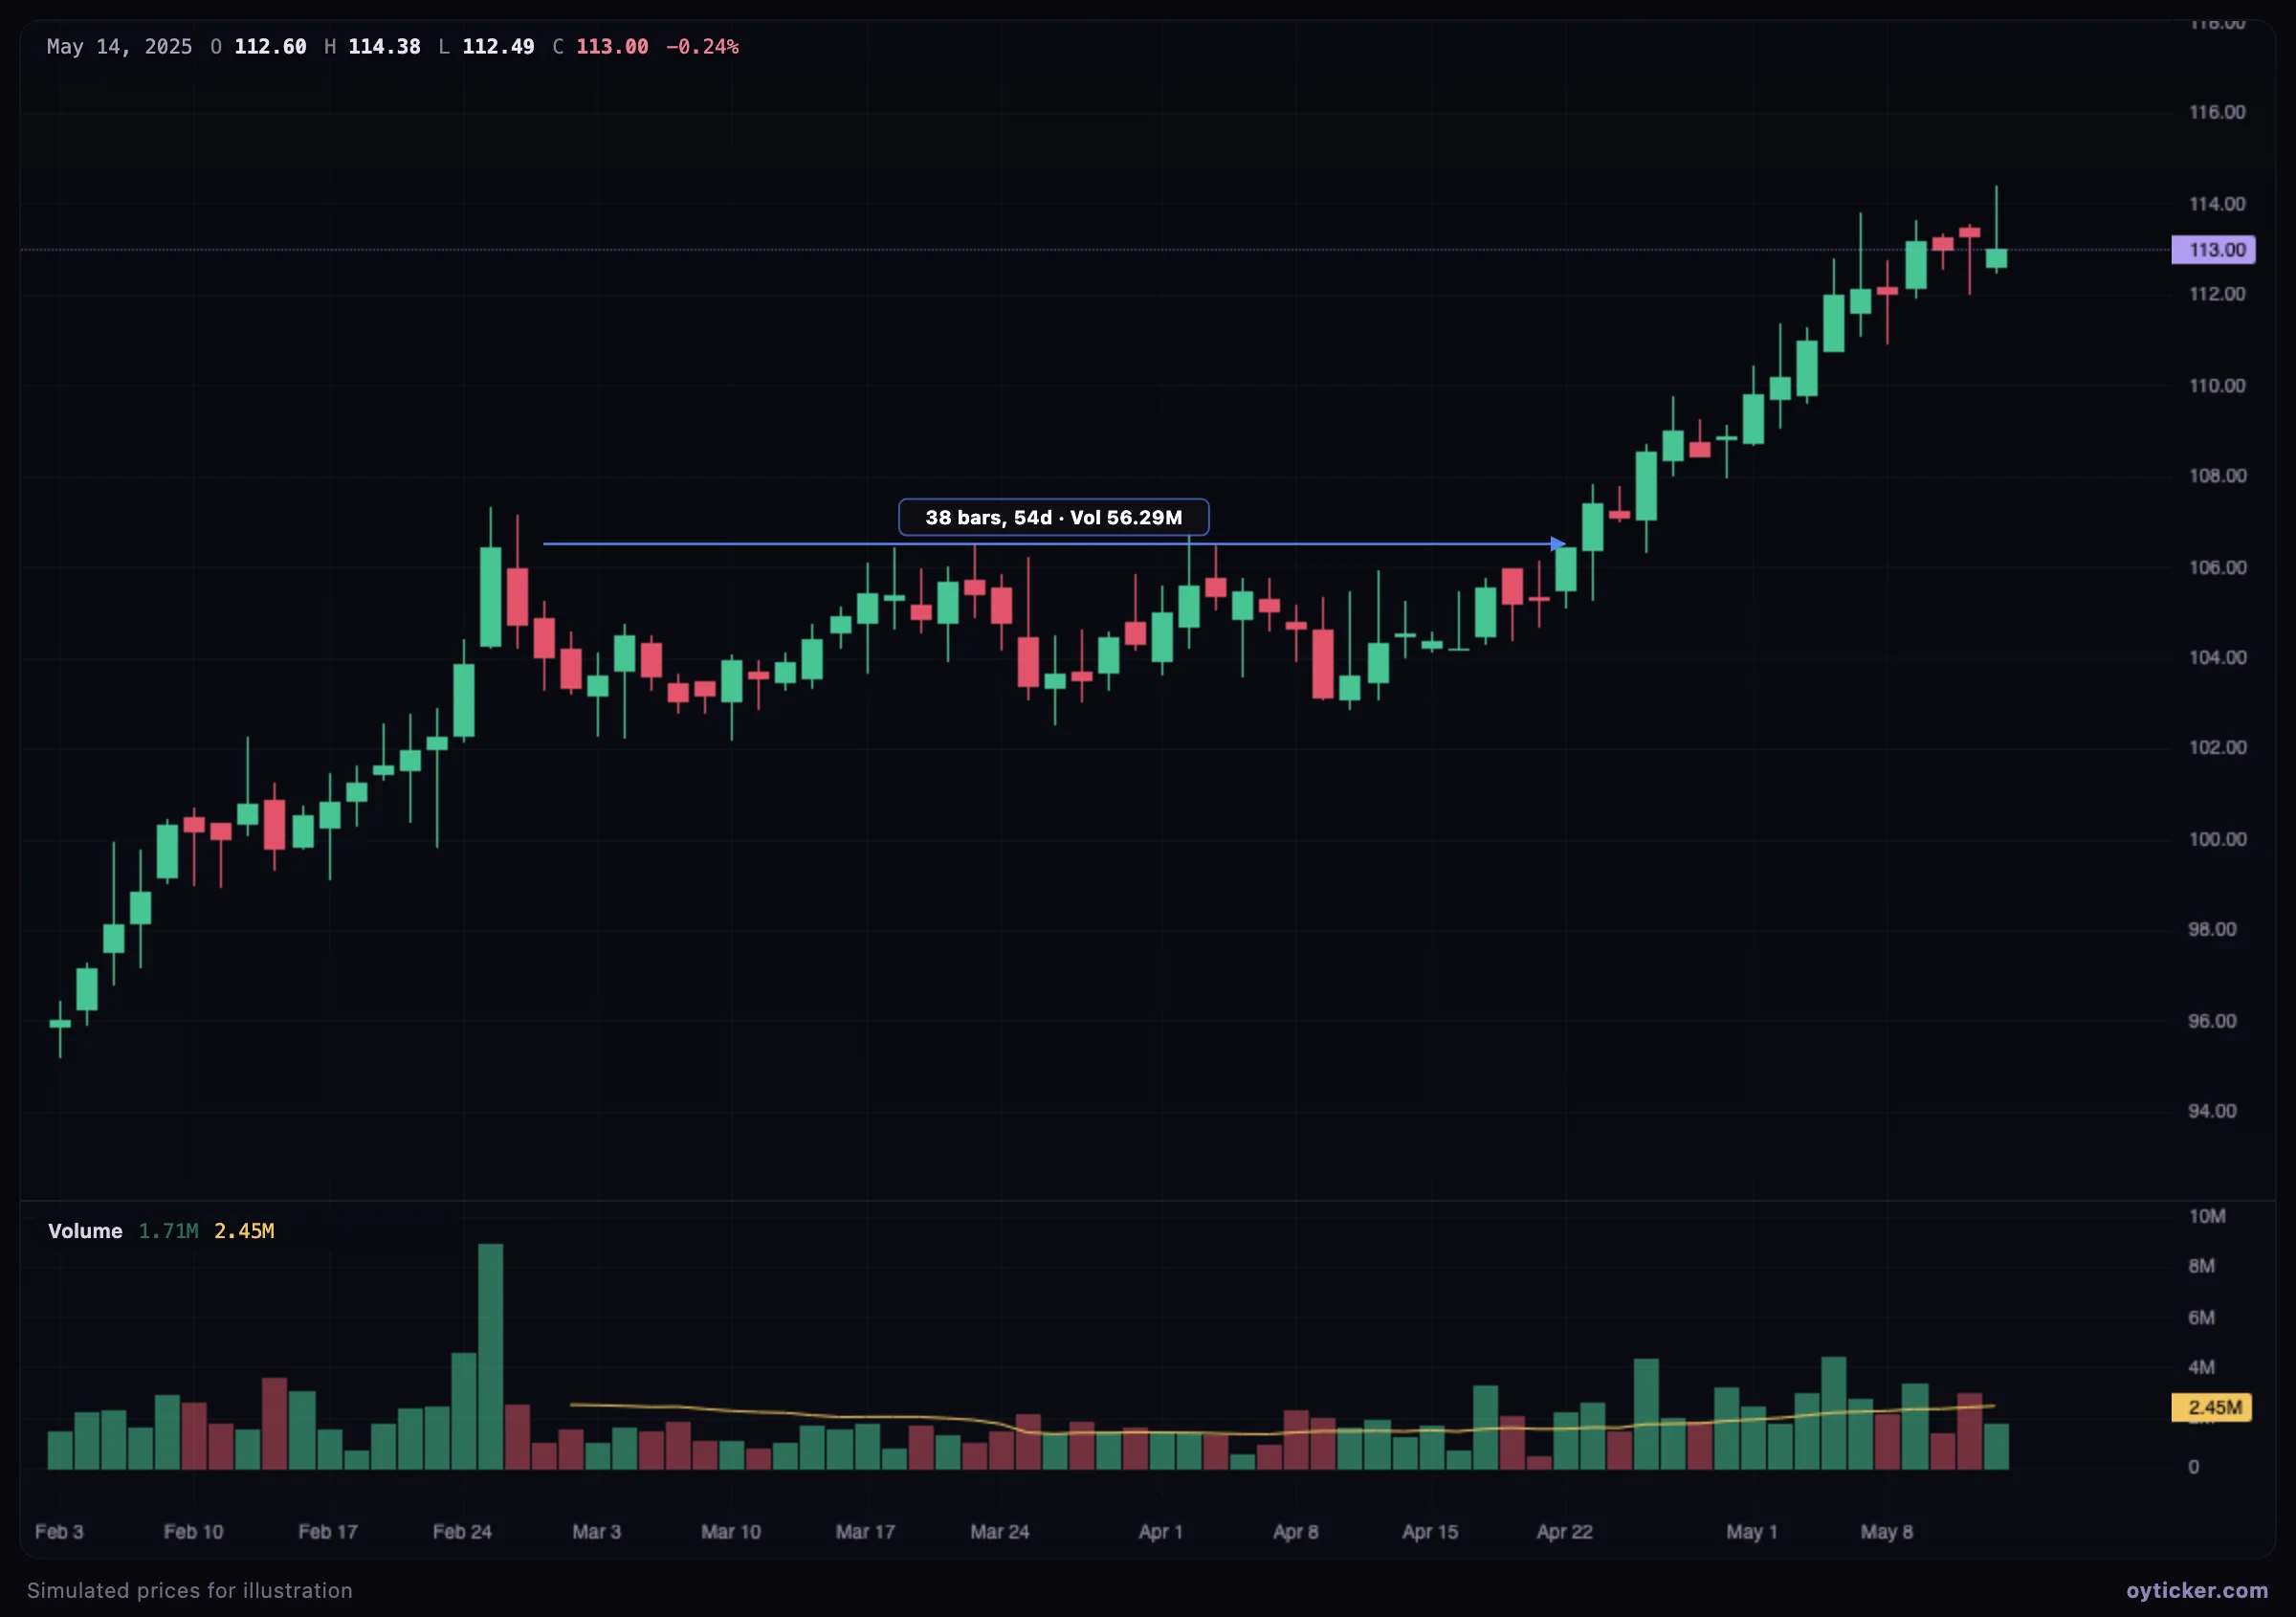
Date range over a sideways consolidation showing 38 bars, 54 days and the volume
The pause after the first advance lasts 38 bars (54 calendar days). The volume pane shows activity drying up during the consolidation and expanding as the advance resumes.

Time is the dimension most traders forget. Comparing the duration of pullbacks and advances (time symmetry) helps judge whether a correction is “normal” for the trend, and longer bases often precede larger moves.

Charts in this guide use simulated prices generated for illustration; levels and outcomes shown are examples, not observations of a real market. Educational content only, not investment advice.