
Example: a stopped short
A tool that only shows winning trades teaches nothing. Here the plan was reasonable (entry after a bounce in a downtrend, R:R 2), and the market proved it wrong.
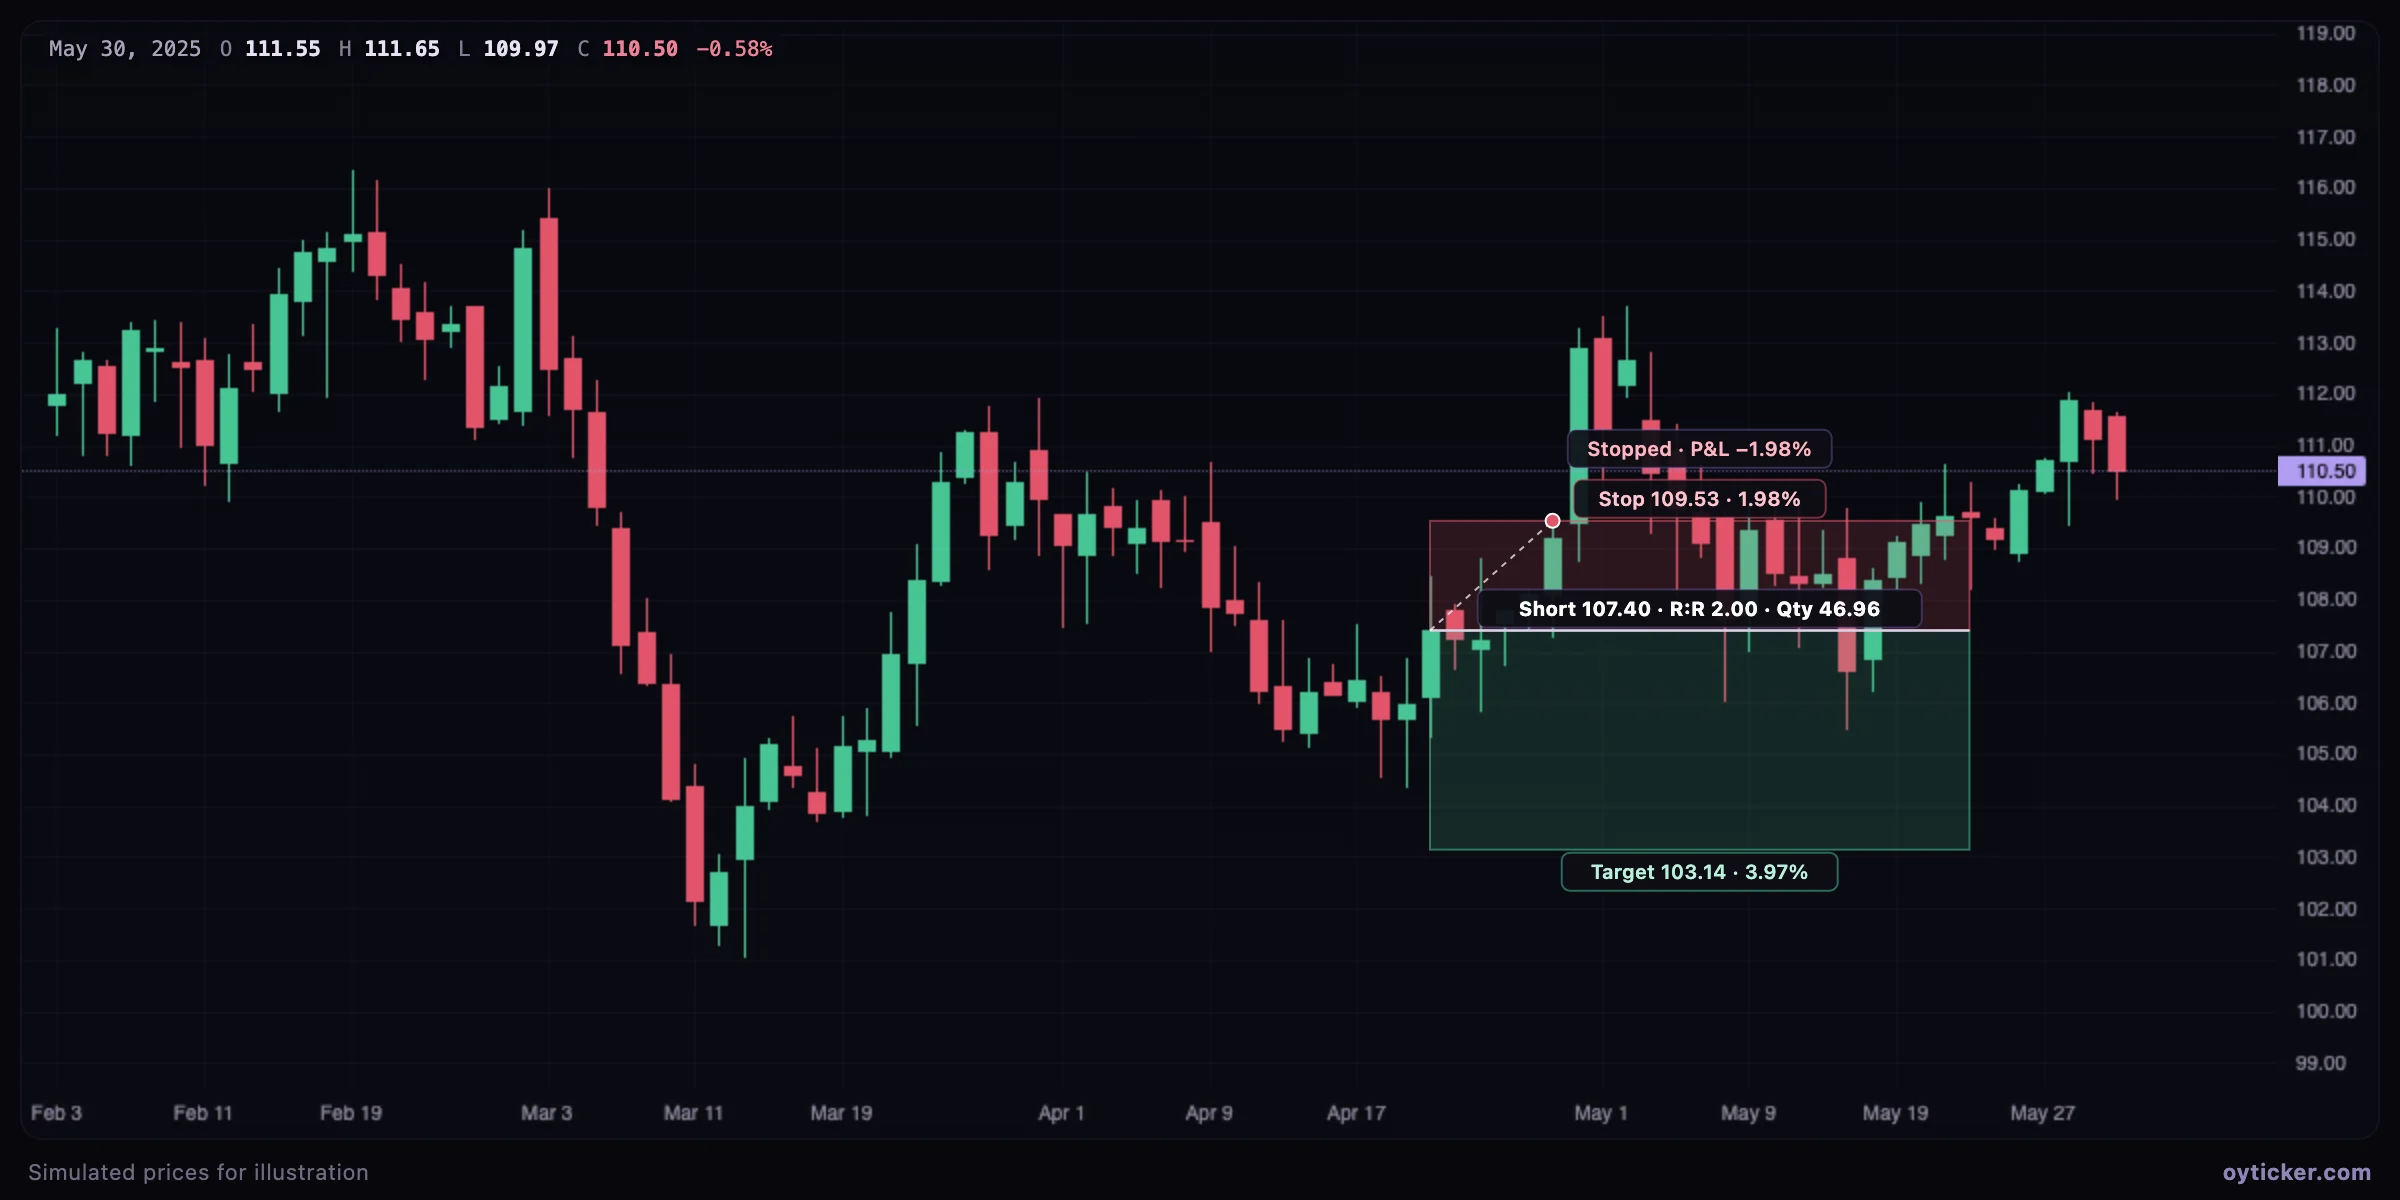
That is the purpose of sizing from the stop: the loss was known and limited before the trade. With a 2:1 reward/risk, a trader breaks even (before costs) by being right one time out of three.
How it works
risk per unit   = |entry − stop|
reward per unit = |target − entry|
R:R             = reward / risk
quantity        = account × risk % / risk per unit
Account size and risk % are set in the tool's options and saved for your account. With 10,000 and 1%, a stop 2.33 below the entry gives a quantity of 100 / 2.33 ≈ 42.9 units.
- Default plan. When placed, the stop is set one ATR(14) away from the entry (at most a sixth of the visible price range, so the tool fits on screen), the target at twice that distance (R:R 2), and the right edge about 18% of the visible bars later (at least 12 bars). Drag any handle to adjust.
- Outcome. From the entry bar to the right edge, the position is filled when a bar trades at the entry price; after that, the first of the target or the stop to be reached closes it, and the status shows the result in percent of the entry.
- Same-bar ambiguity. When one bar reaches both the target and the stop, the chart cannot tell which came first; Oyticker counts it as stopped, the conservative assumption, and says so.
Specific to short selling
- The loss on a short is not capped by the price falling to zero: a squeeze can move far above the stop, and gaps make it worse. Size conservatively.
- Borrow costs and the availability of shares to borrow are not modeled.
Limits
- Results assume fills exactly at the entry, stop and target prices. A gap through the stop fills at the opening price, which can be much worse; liquidity and slippage matter on fast markets.
- Commissions, financing and taxes are not included.
- A backward-looking result on one example says nothing about the expectancy of a method; test many cases before trusting a setup.
Charts in this guide use simulated prices generated for illustration; levels and outcomes shown are examples, not observations of a real market. Educational content only, not investment advice.