
What a trend line shows
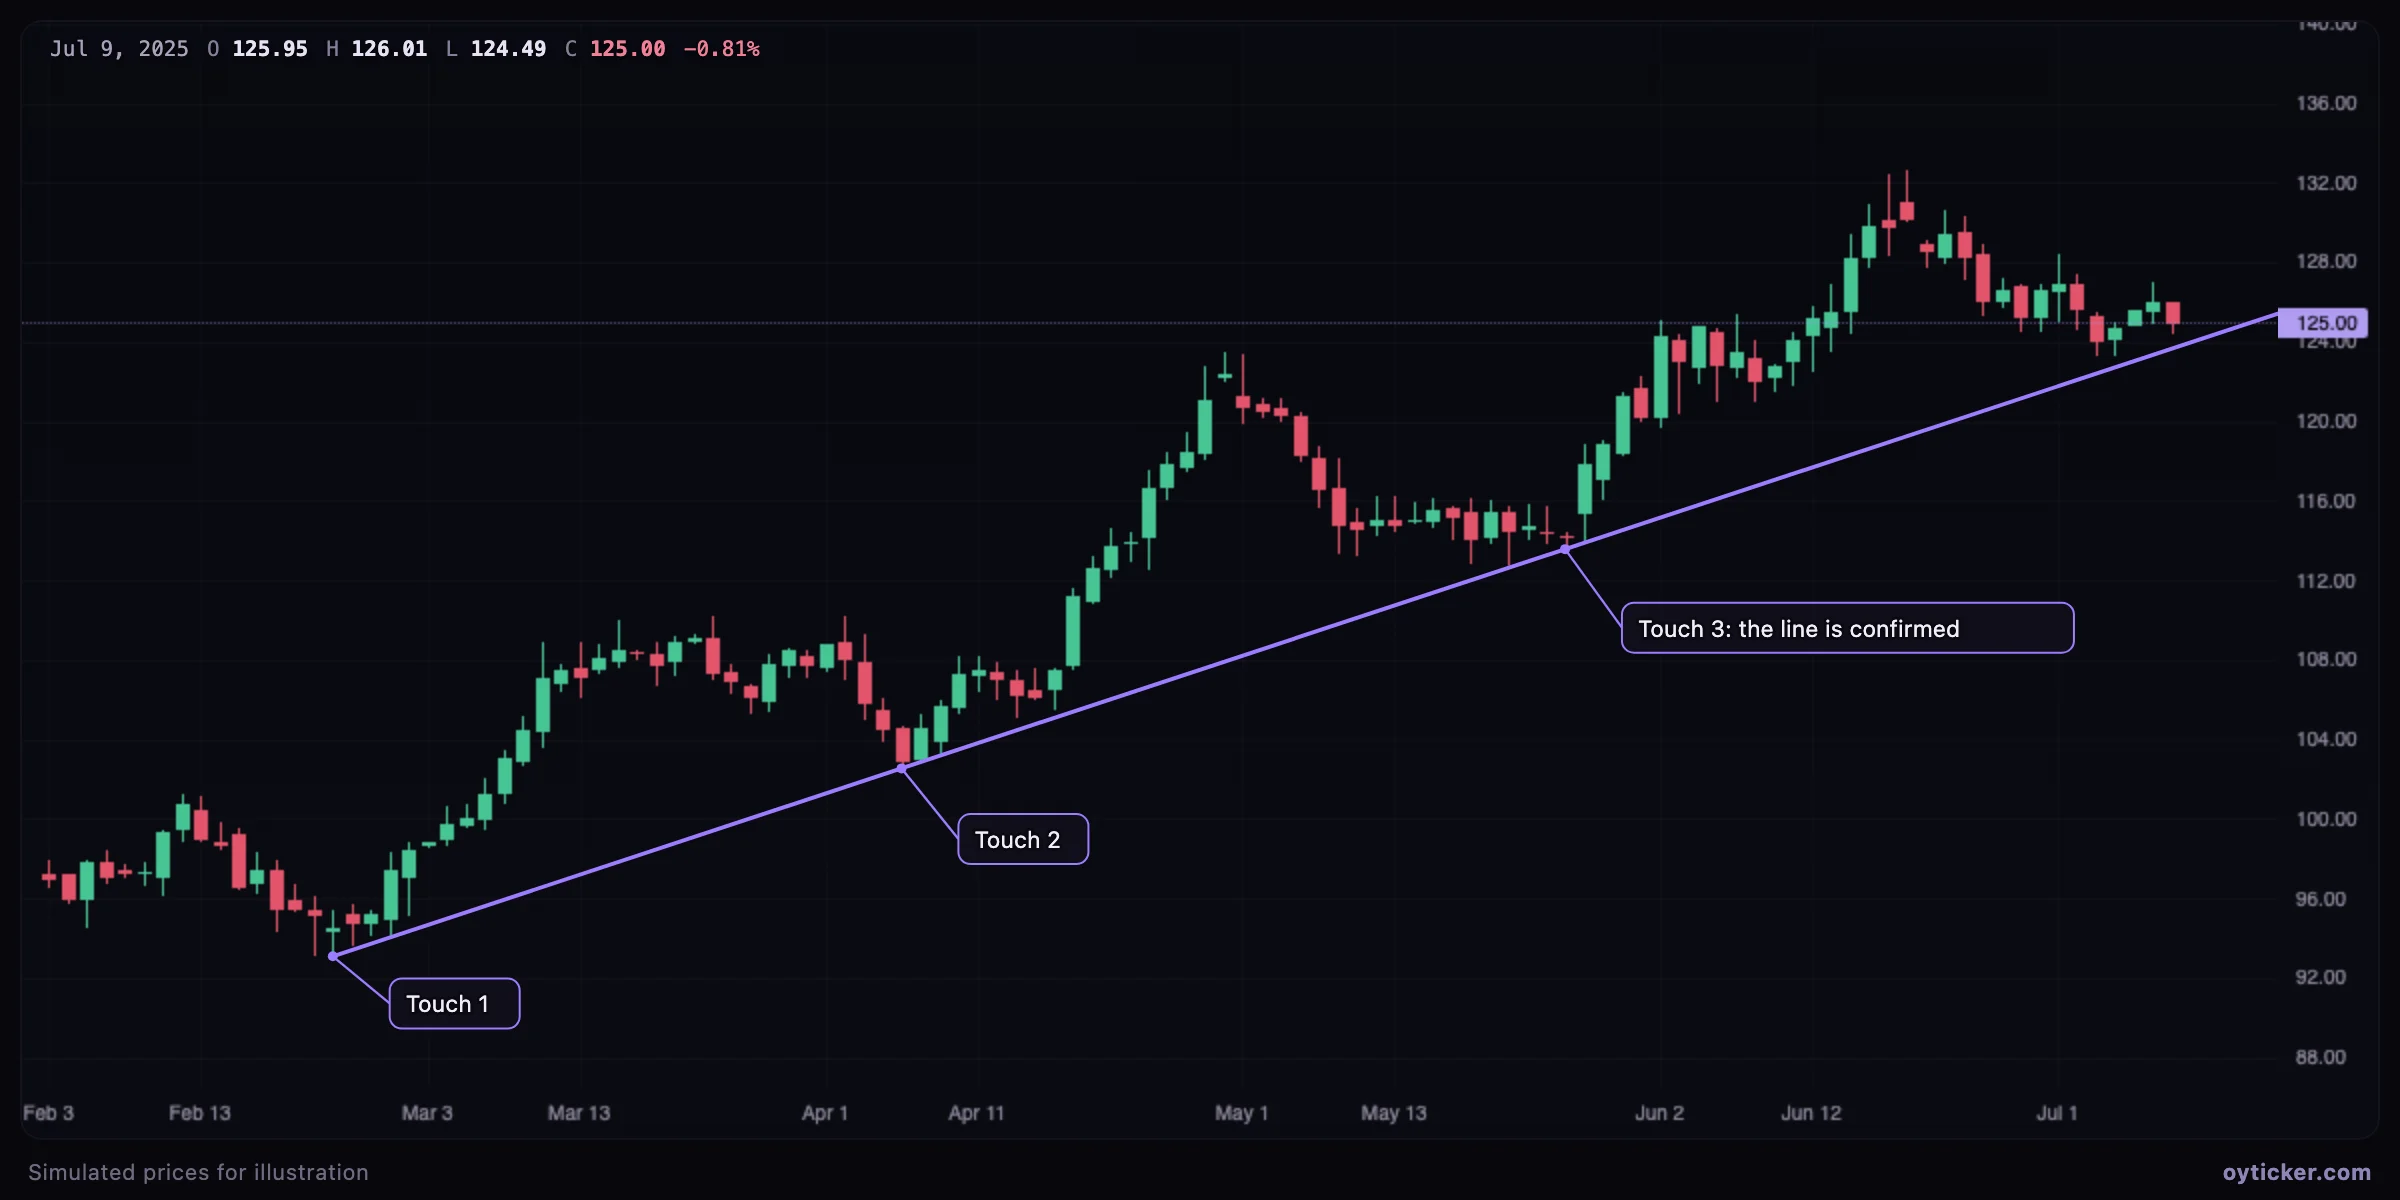
An uptrend is a sequence of higher lows and higher highs. Joining two of its swing lows gives a line under the price: as long as pullbacks end on or above it, the trend's structure is intact. The line is a hypothesis drawn from two points; each later reaction on the line is evidence that market participants watch the same slope.
The slope itself is information. A steep line describes an accelerating market that is hard to sustain; a gentle line describes a trend that can last but leaves more room for pullbacks. In a downtrend the same logic applies to swing highs and a line above the price.
How to draw it in Oyticker
- Open Analyze, click the Lines button in the left toolbar and choose Trend line.
- Click the first swing low (or high), then the second one. You can also press on the first point and release on the second, which is the natural gesture on a phone.
- With the magnet on, points snap to the open, high, low or close of the nearest candle within a few pixels, so the line passes exactly through the wick or the body you aimed at.
- Select the line to move it, drag a handle to adjust one end, or tick Extend right to project it into the future. While selected, the line shows the price change, the percentage and the number of bars between its two points.
How to read it: touches, breaks and retests
- Touches. A reaction on the line (a long lower wick, a bullish candle, a higher low) shows that the slope is defended. Two points draw a line; a third touch validates it.
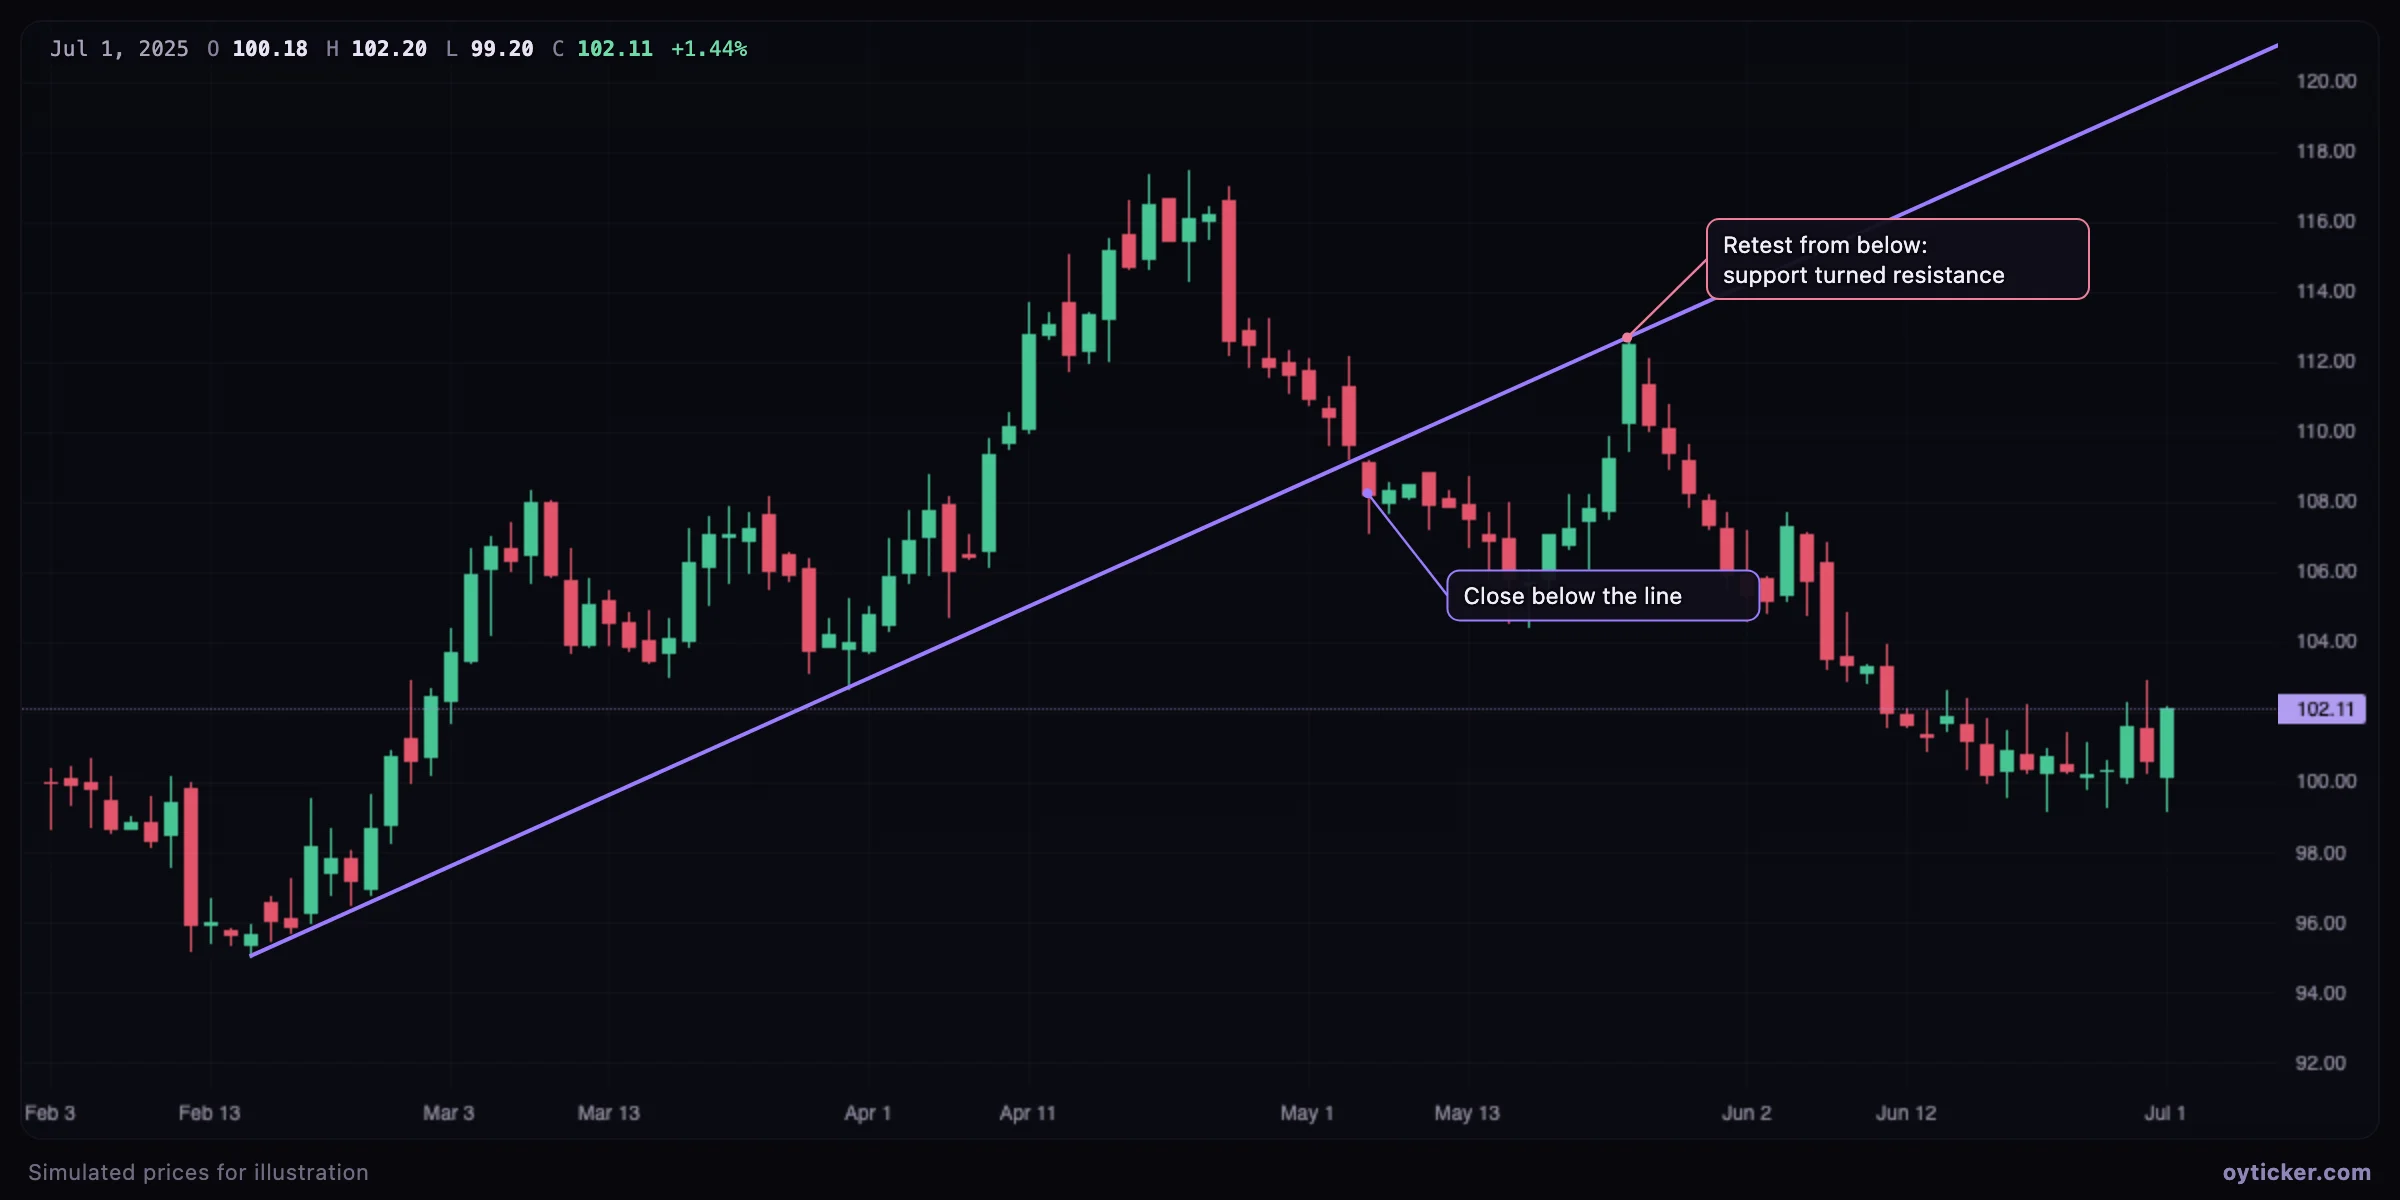
- Break. A close beyond the line, not just a wick through it, signals that the trend's structure changed. On daily charts many traders wait for the close of the day before calling a break.
- Retest. After a break, price often comes back to the line from the other side. The former support then acts as resistance (or the reverse). A failed retest is often a better-defined trade than the break itself, because the invalidation level is close.
Case study: a broken steep line is not always a reversal
Trends often start steep and then slow down. When the steep line breaks, the market may simply move to a gentler slope rather than reverse. Redraw a second line from the same origin through the new higher low: if it holds, the trend is intact at a slower pace. This sequence of flatter lines is sometimes called a fan.
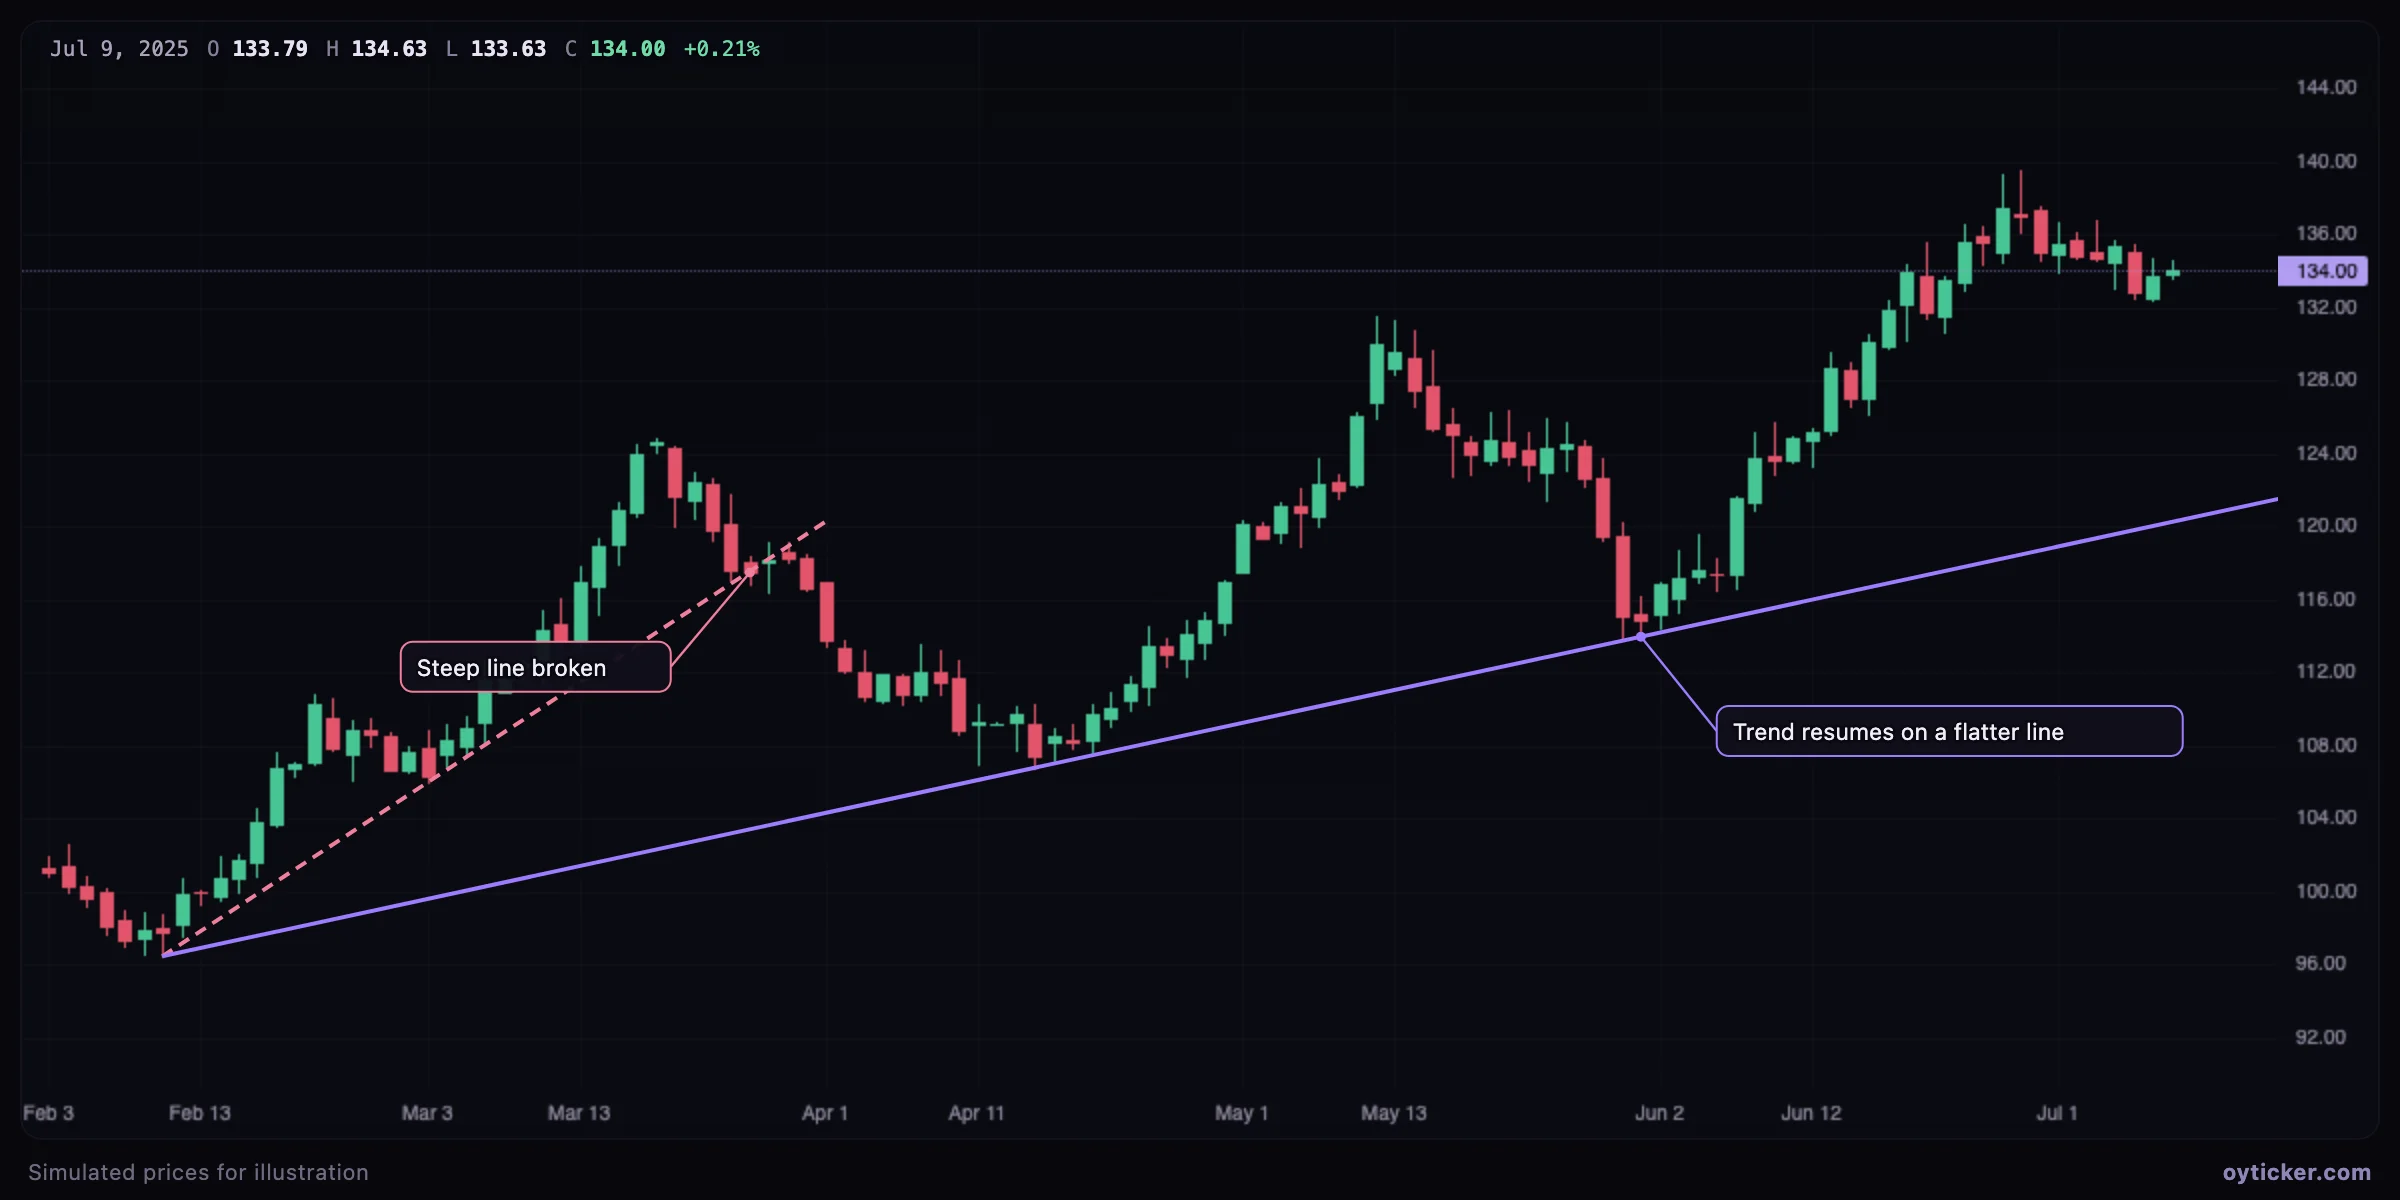
The rule that decides between “slower trend” and “reversal” is the swing structure, not the line: as long as lows keep rising, the uptrend stands. A lower low after the break is what turns a trend line break into a change of trend.
Limits and common mistakes
- Forcing the line. Moving a point to pass through more candles makes a nicer picture but a less objective line. Anchor on clear swing points of the timeframe you trade.
- Too many lines. If every small pullback gets its own line, none of them means anything. Keep the lines that describe the trend you trade.
- Scale. Oyticker charts use a linear price scale. Over very large moves (several tens of percent), a line drawn on a logarithmic scale would be placed differently; keep that in mind on long-term charts of fast-growing assets.
- Timeframe. A line drawn on daily candles describes the daily trend. It can be broken many times on a 1-minute chart without meaning anything on the daily one.
- Breaks on gaps. When the price gaps through a line, the break is real but there is no clean retest level; the line is less useful for entries afterwards.
Charts in this guide use simulated prices generated for illustration; levels and outcomes shown are examples, not observations of a real market. Educational content only, not investment advice.