
Calculation
basis = SMA(close, 20)
σ     = population standard deviation of the last 20 closes
upper = basis + 2σ,  lower = basis − 2σ
The population standard deviation (dividing by n) is the definition used by John Bollinger and by TradingView.
Statistically, about 95% of observations would fall within ±2σ for normally distributed data; prices are not normal (fat tails, trends), so closes outside the bands are more frequent than 5%, especially in trends.
The squeeze
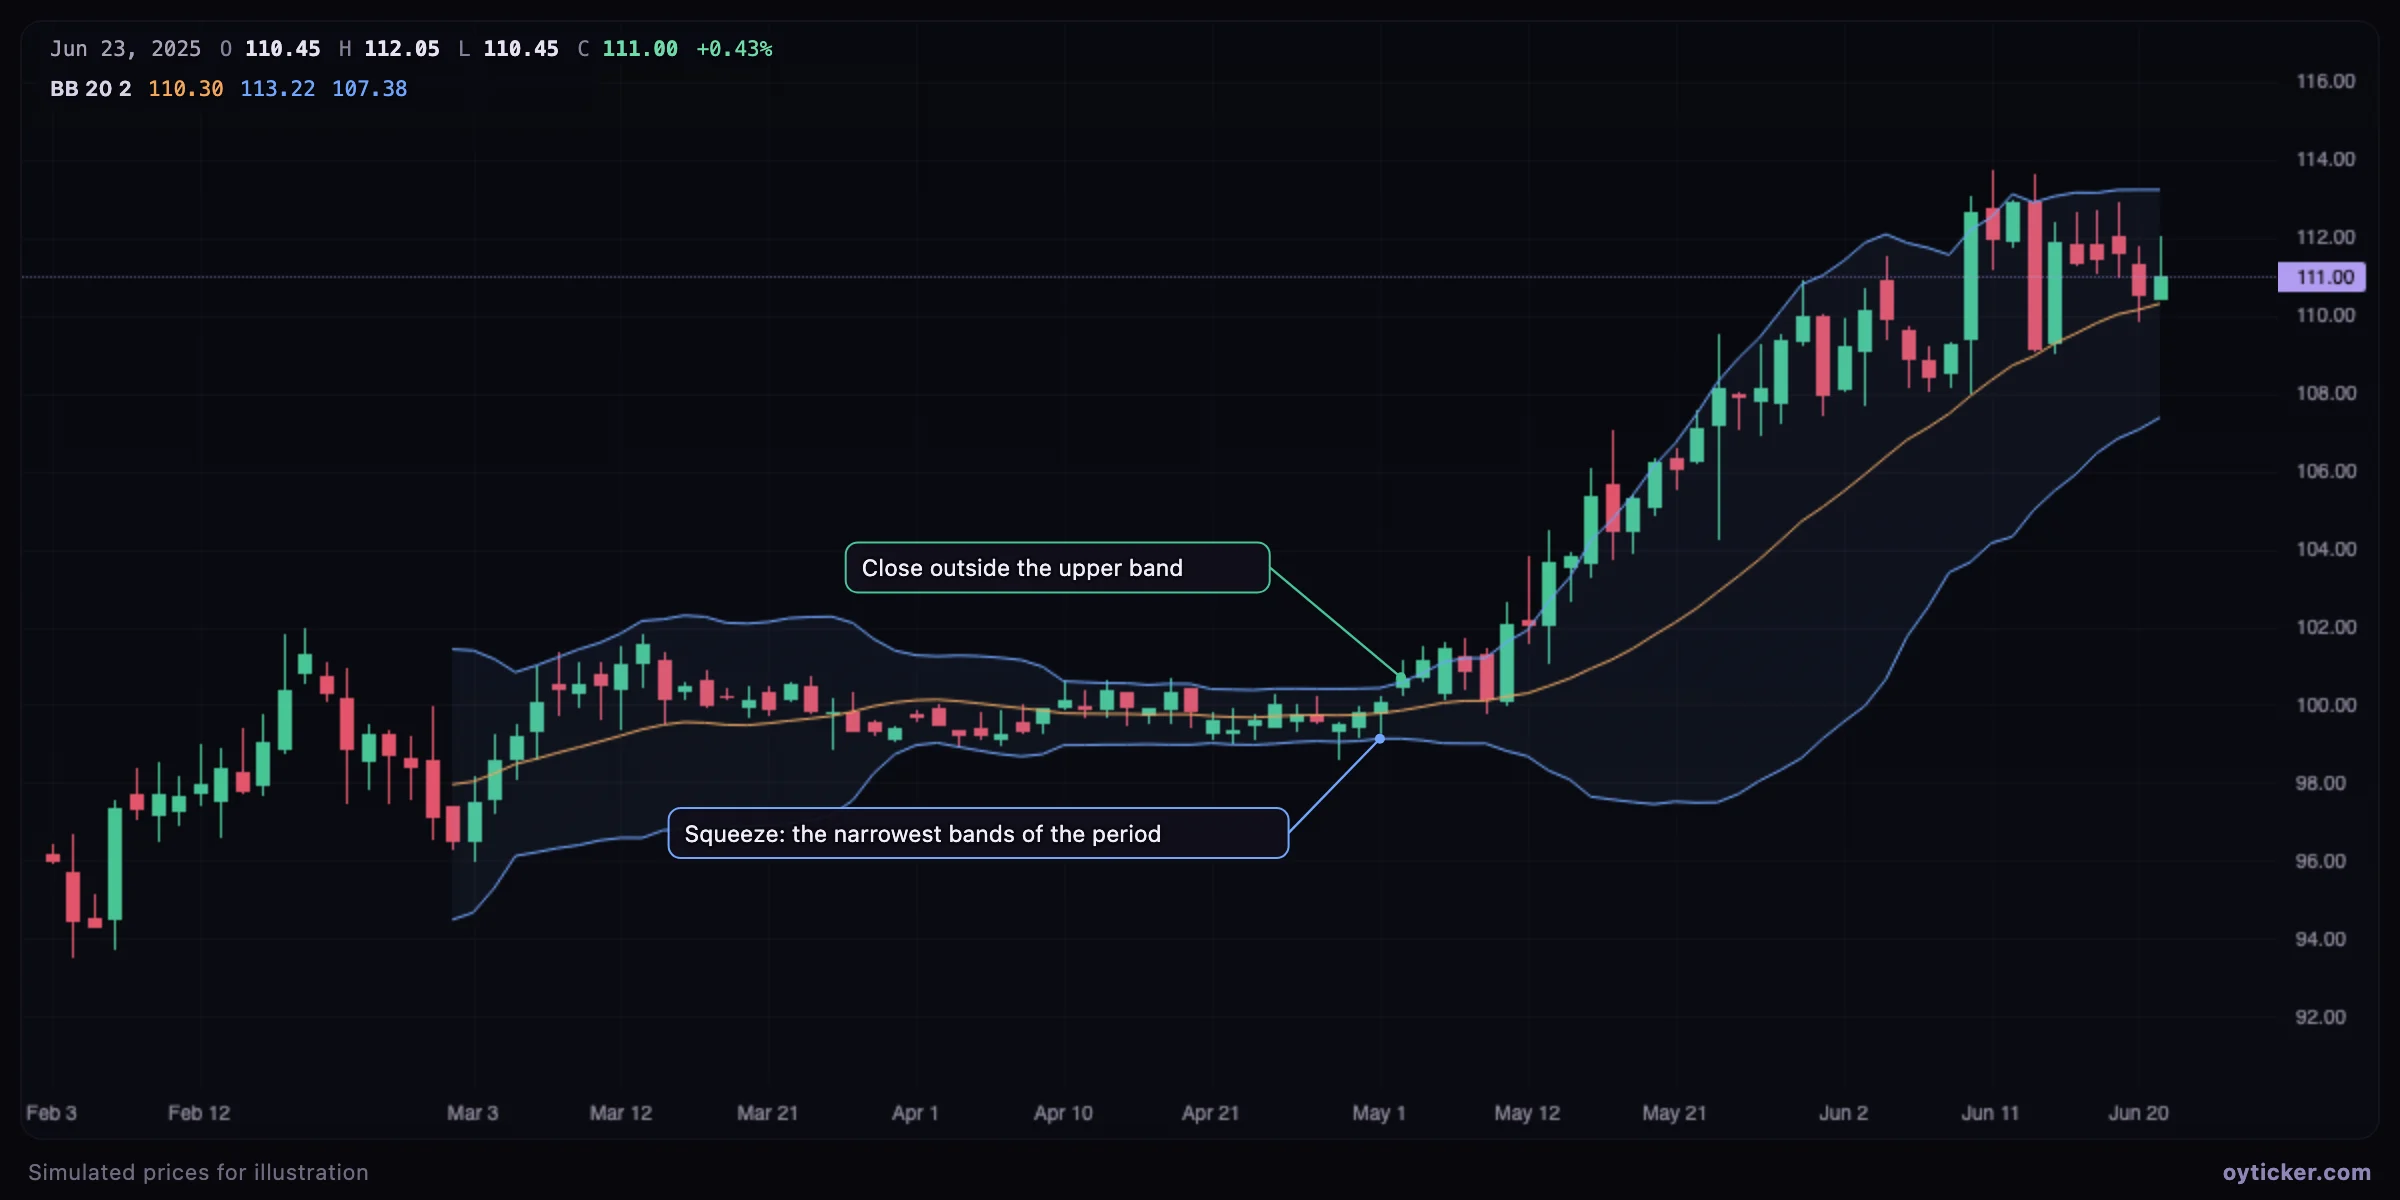
Periods of low volatility tend to be followed by periods of high volatility. A squeeze (unusually narrow bands) does not tell the direction of the next move, only that one is likely; the break of the range or of the bands gives the direction.
Walking the bands
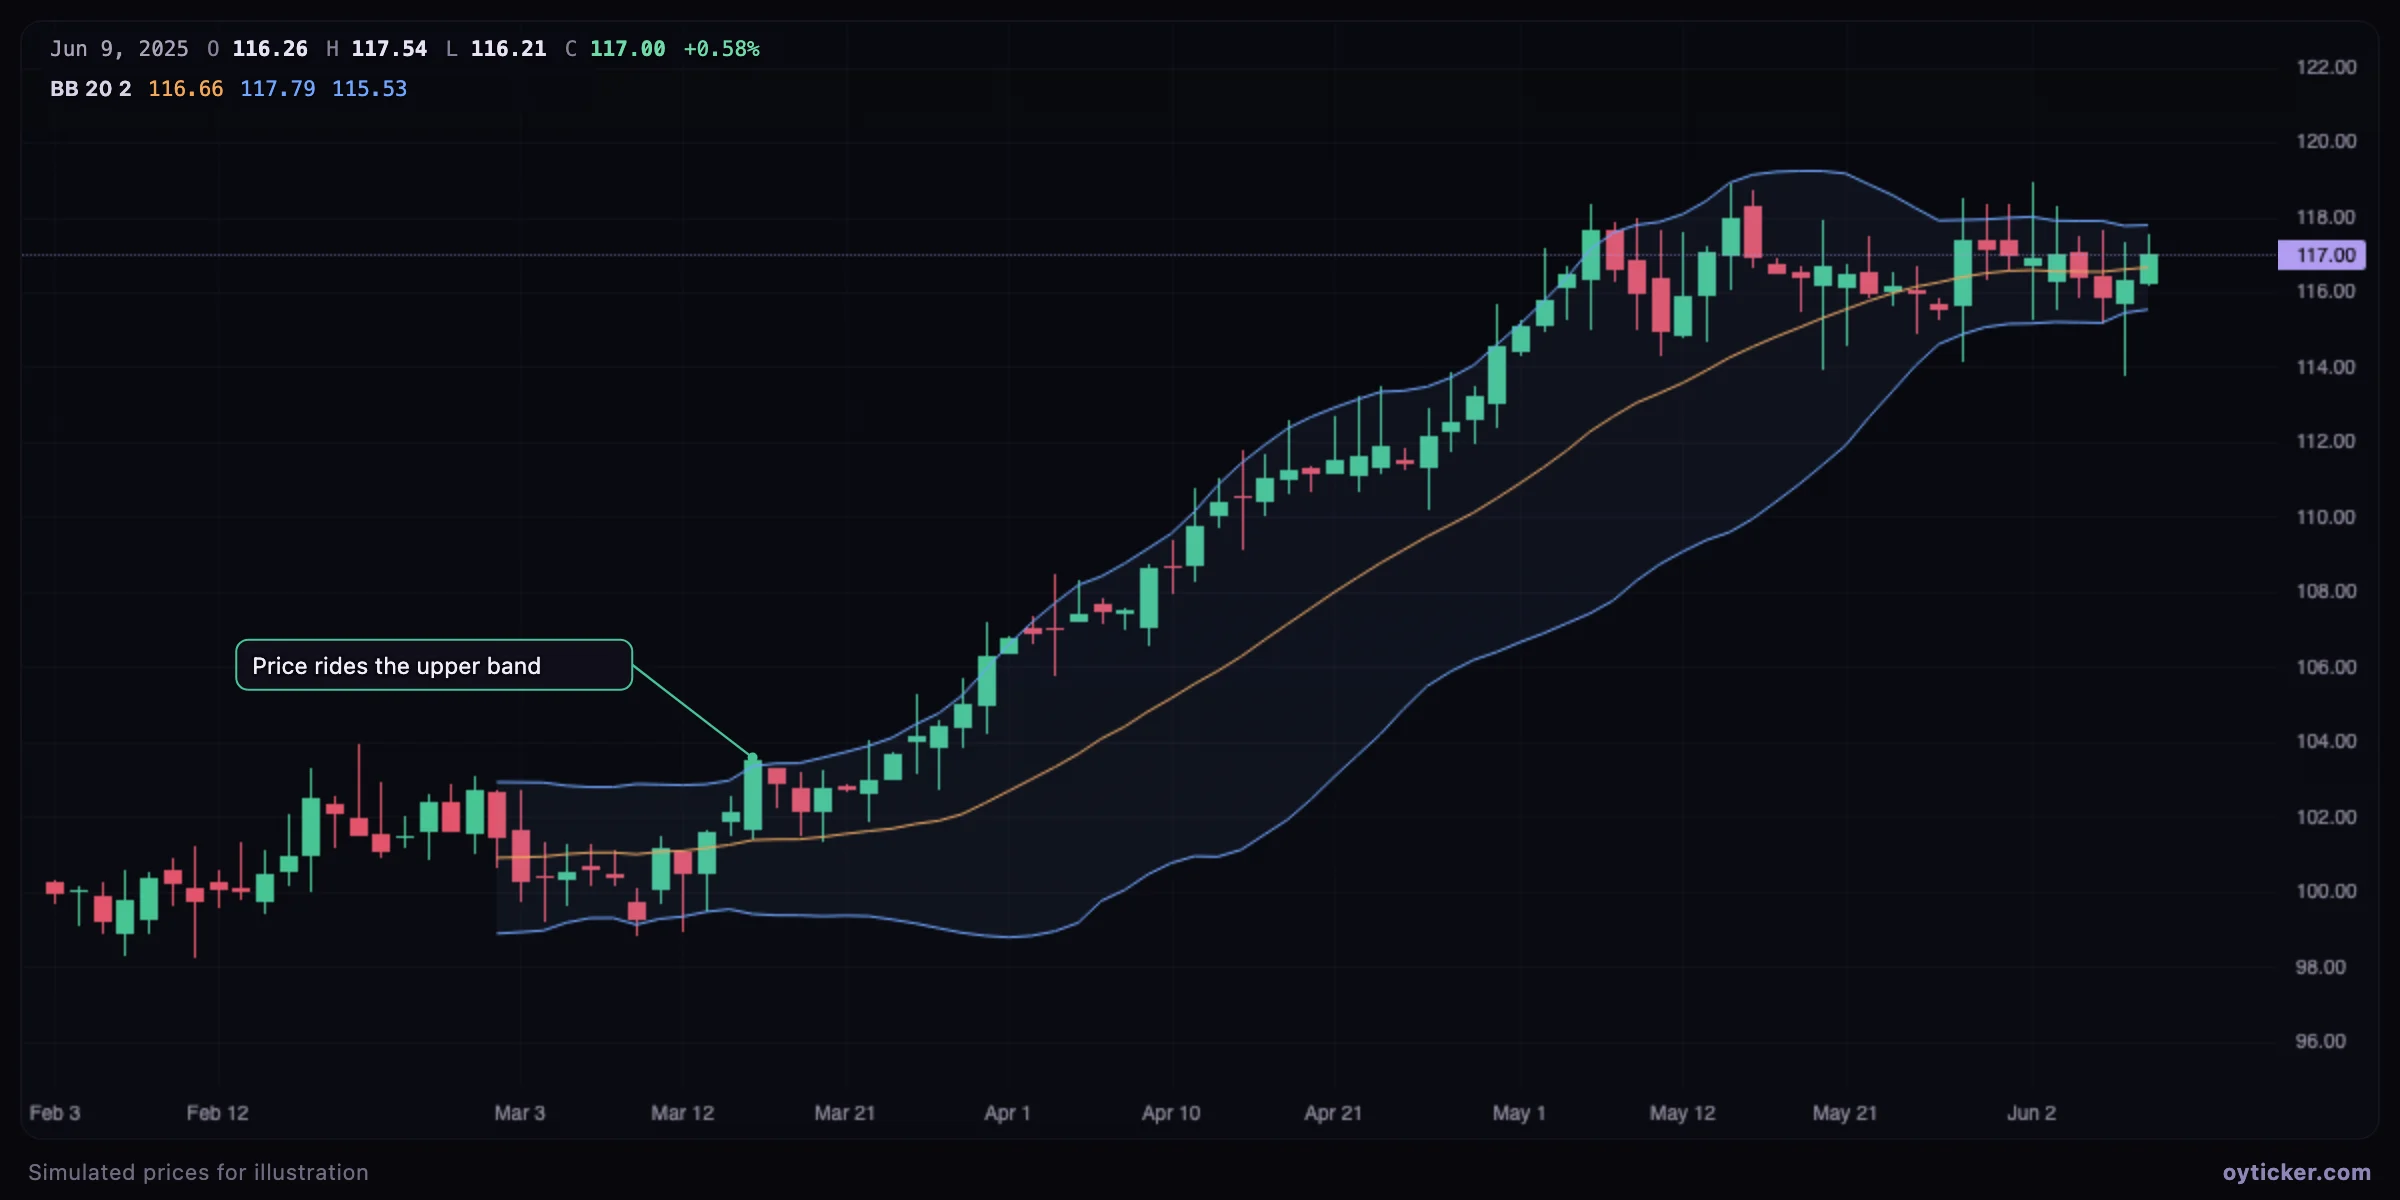
Bollinger himself insisted that a touch of a band is not a signal in itself. In a range, extremes at the bands tend to revert to the middle; in a trend, price can walk the band for many bars. Use the context (and, for instance, the middle band as trailing support) rather than selling every upper-band touch.
Add it in Oyticker
- Click Indicators → Bollinger Bands.
- Click its legend to change the length, the number of standard deviations or the source.
Limits
- The bands describe recent volatility; they do not predict direction.
- A 20-bar window adapts quickly: after a volatility shock the bands stay wide for 20 bars, then suddenly narrow when the shock leaves the window.
Charts in this guide use simulated prices generated for illustration; levels and outcomes shown are examples, not observations of a real market. Educational content only, not investment advice.