
Calculation
SMA(n)  = (x₁ + … + xₙ) / n                         the last n values
EMA(n)  = α·x + (1 − α)·EMA[1],  α = 2 / (n + 1)     started from the SMA of the first n values
WMA(n)  = (n·x + (n−1)·x[1] + … + 1·x[n−1]) / (n(n+1)/2)
HMA(n)  = WMA( 2·WMA(n/2) − WMA(n), √n )            n/2 and √n rounded down
x is the chosen source: close by default, or open, high, low, hl2, hlc3, ohlc4. These are the definitions used by TradingView's built-in averages.
| Type | Character |
|---|---|
| SMA | Equal weights; smooth, slowest to turn |
| EMA | More weight on recent prices; turns sooner, follows price more closely |
| WMA | Linearly decreasing weights; between SMA and EMA |
| Hull | Designed by Alan Hull to reduce lag while staying smooth; can overshoot at turns |
How to read it
- Slope: a rising average describes an uptrend; flat means no trend.
- Price position: price above a rising average is the normal state of an uptrend; pullbacks to it are often bought in strong trends (the 20- and 50-period averages are the most watched).
- Two averages: the faster one above the slower one confirms an uptrend. On daily charts, the 50-day crossing above the 200-day is called a golden cross, the opposite a death cross.
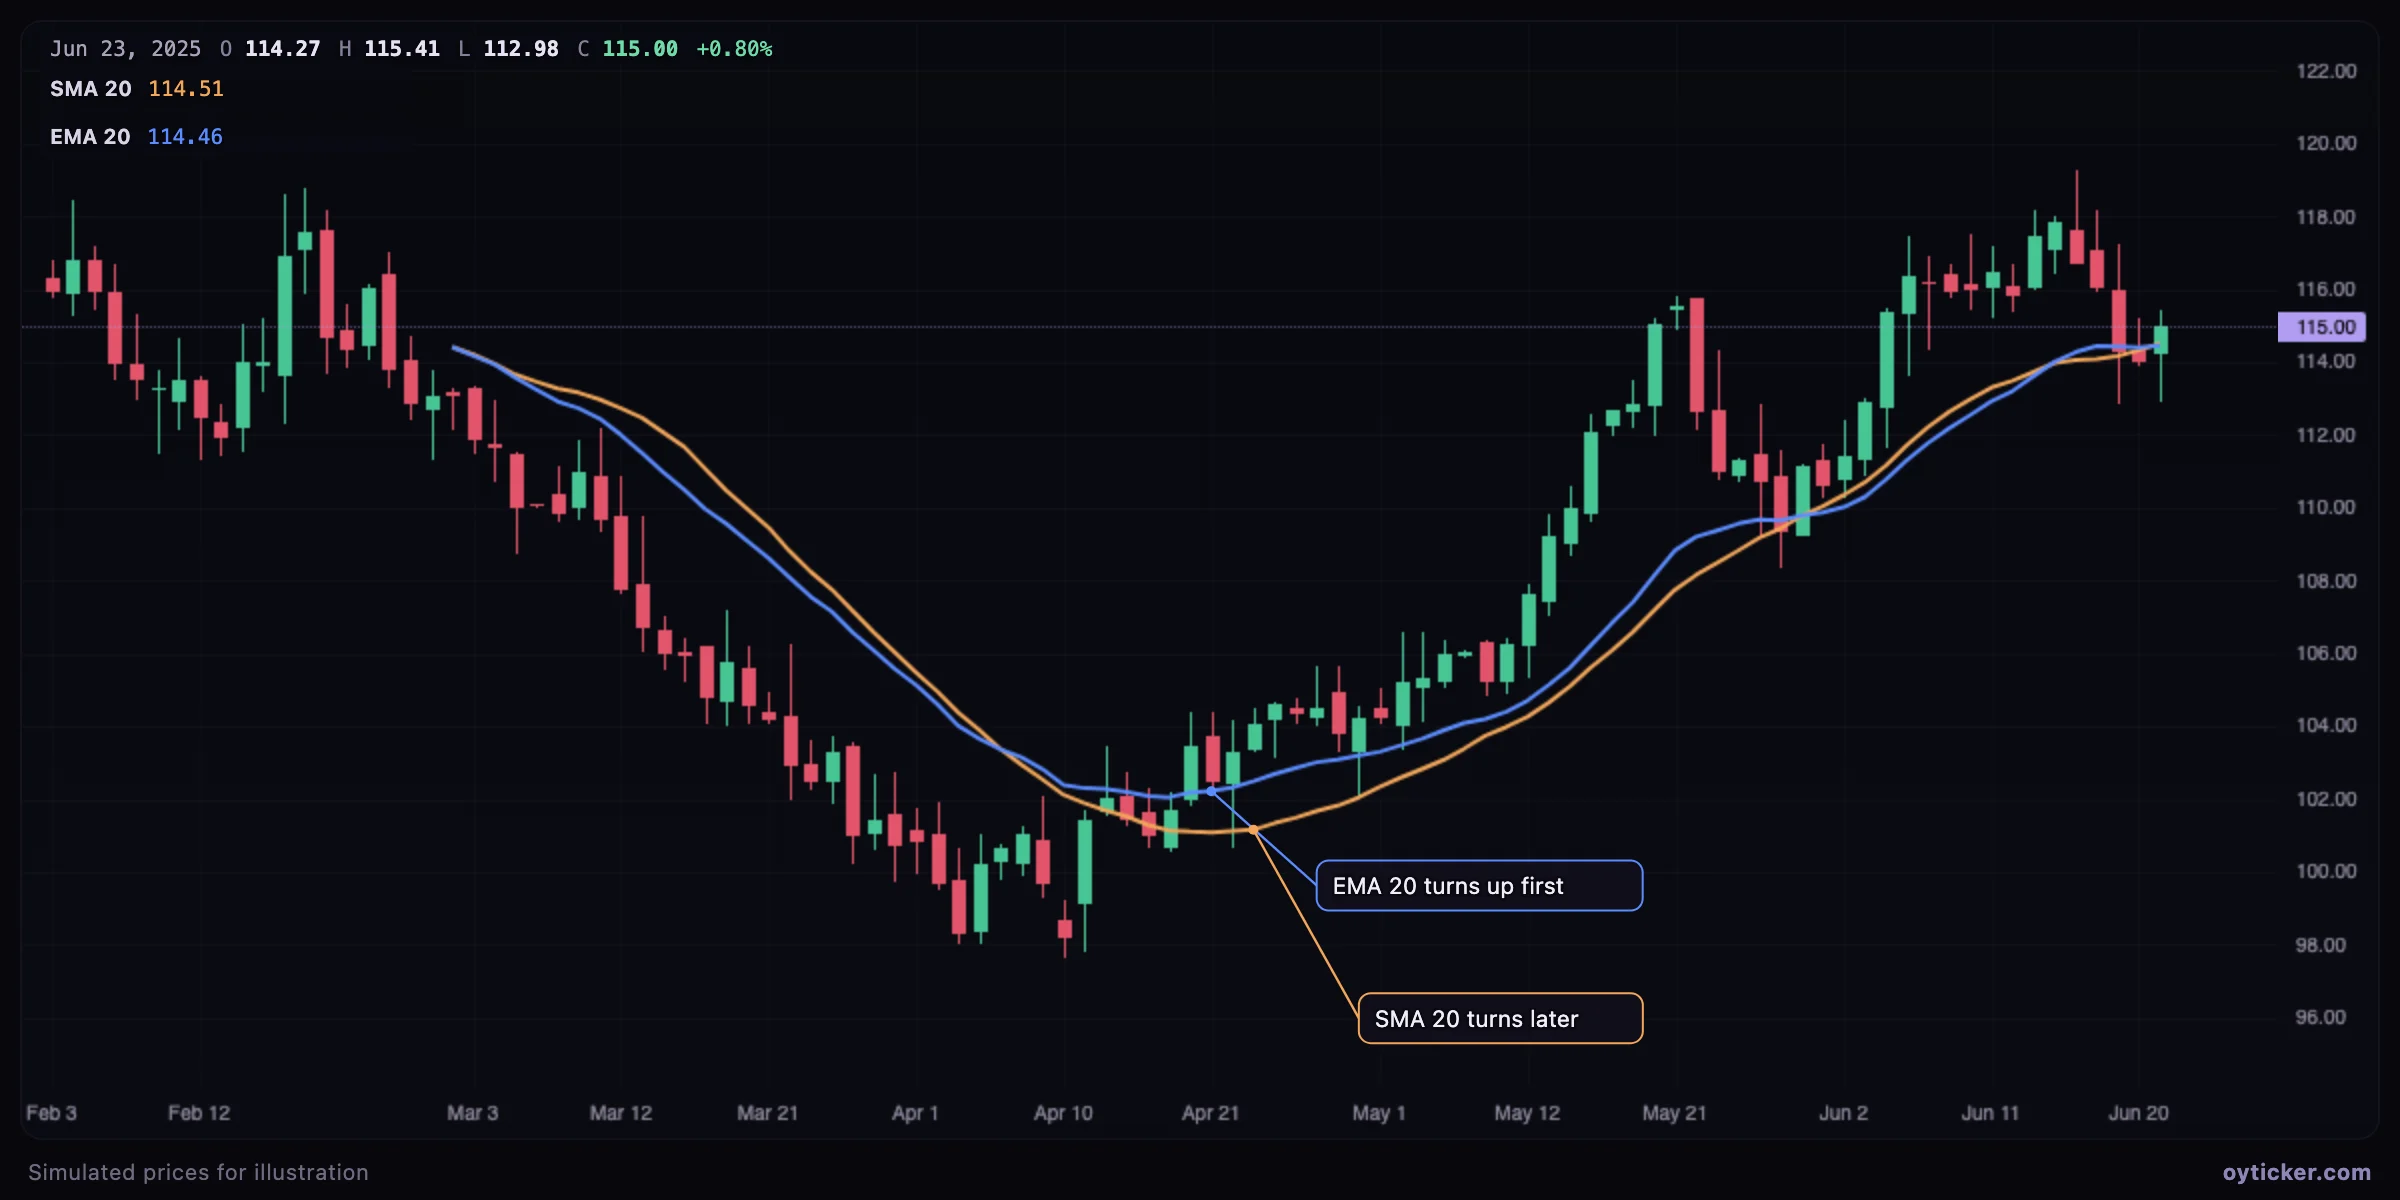
Case study: the golden cross is late by design
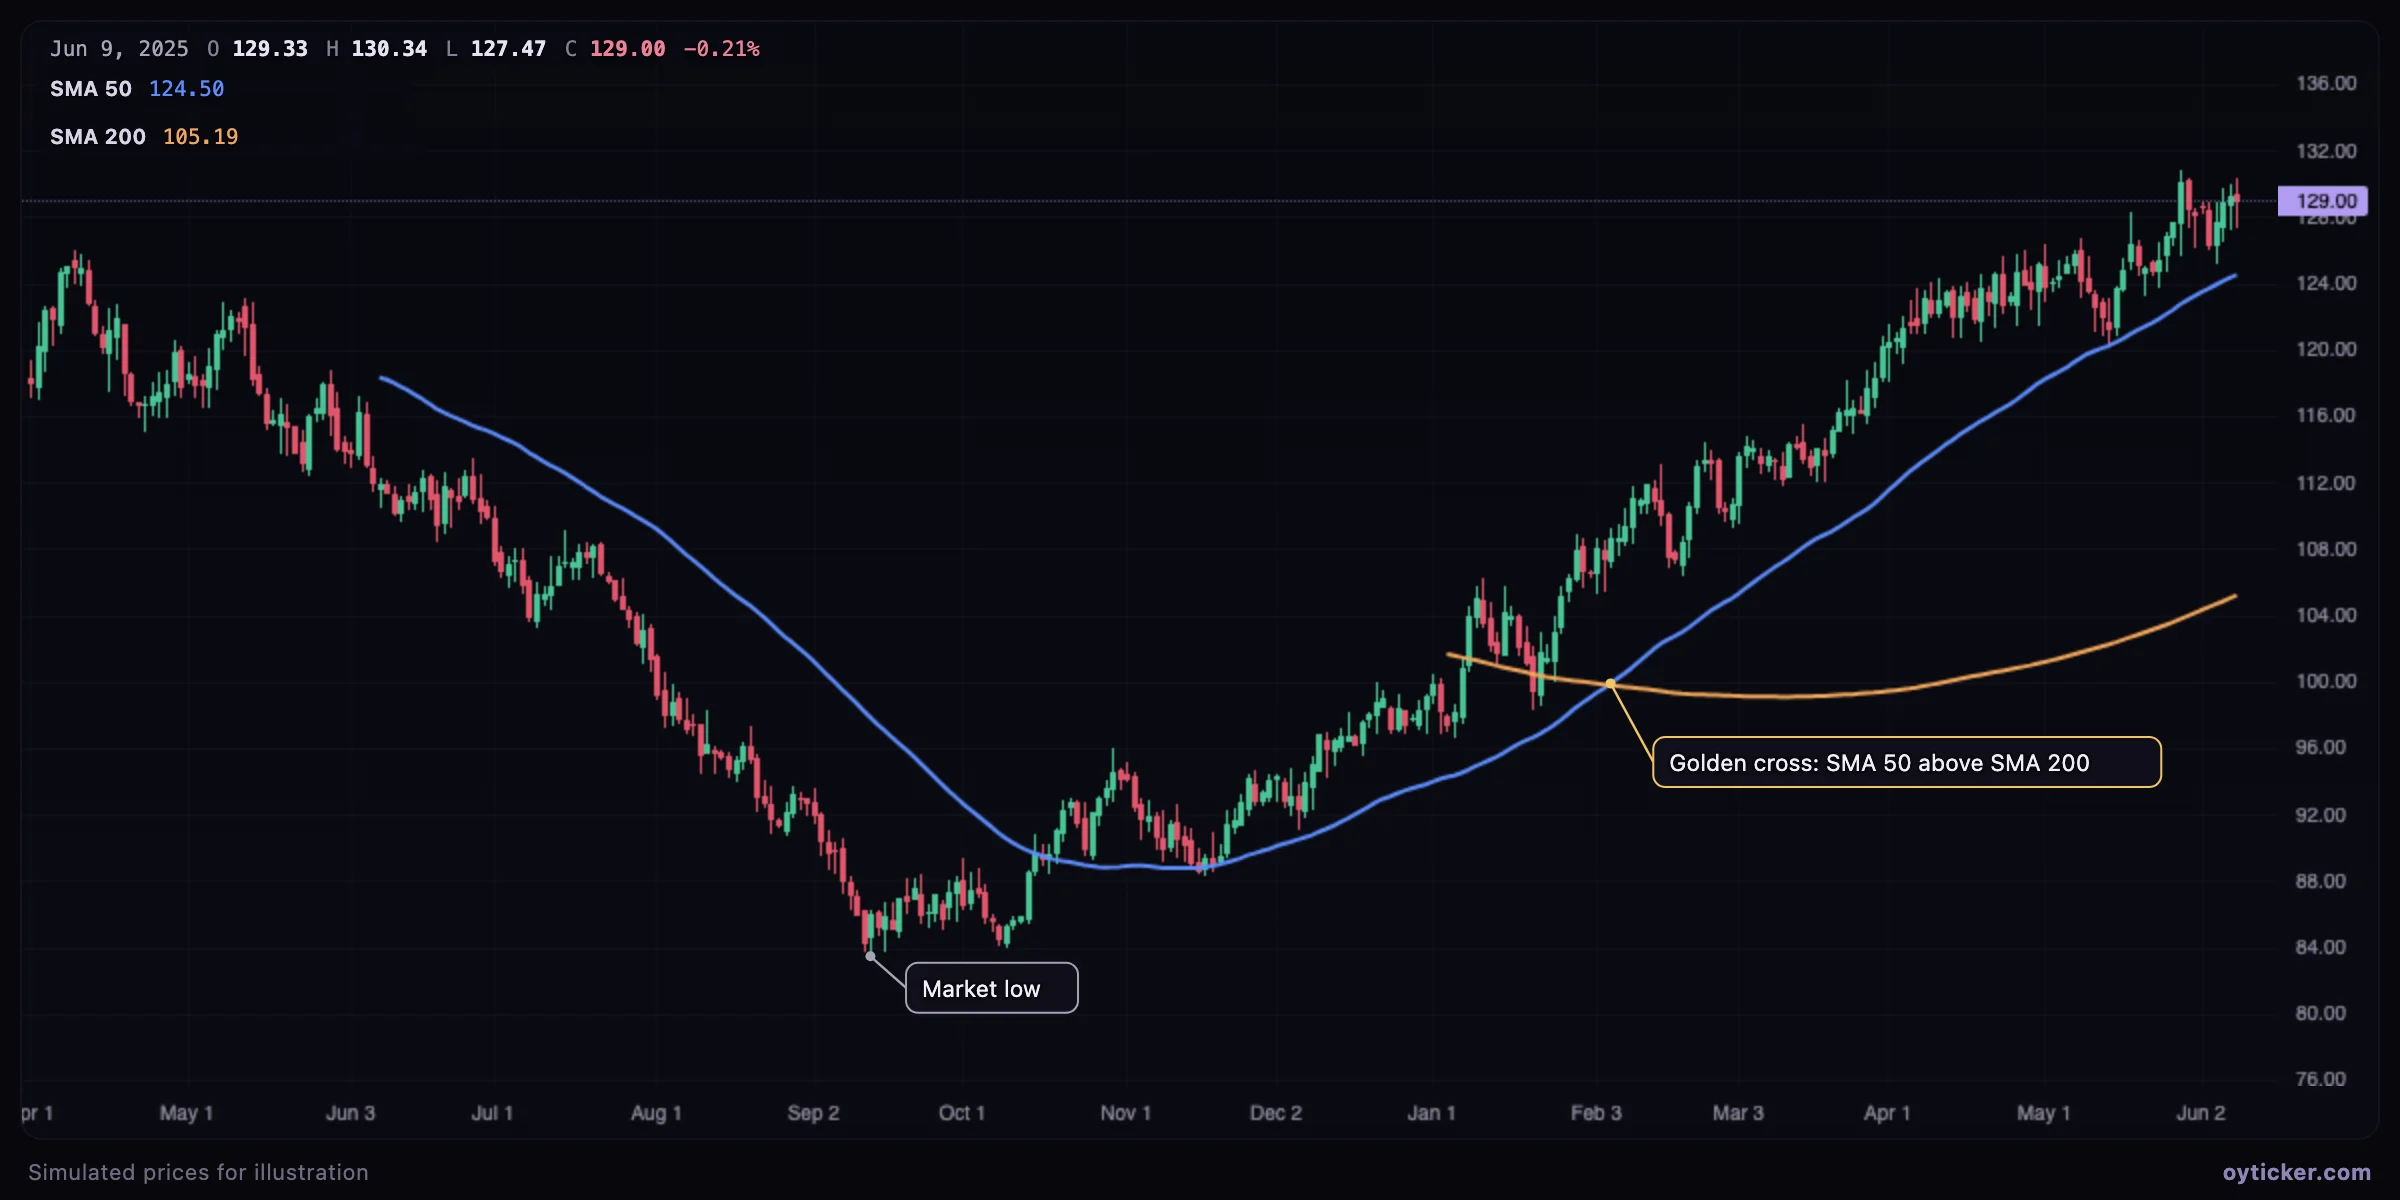
A 200-day average describes almost a year of prices, so a crossover with it confirms a change of trend long after it started. That is its purpose: a slow, robust filter for the long-term regime (many investors only hold an asset above its 200-day average), not an entry timing tool.
Case study: whipsaws in a range
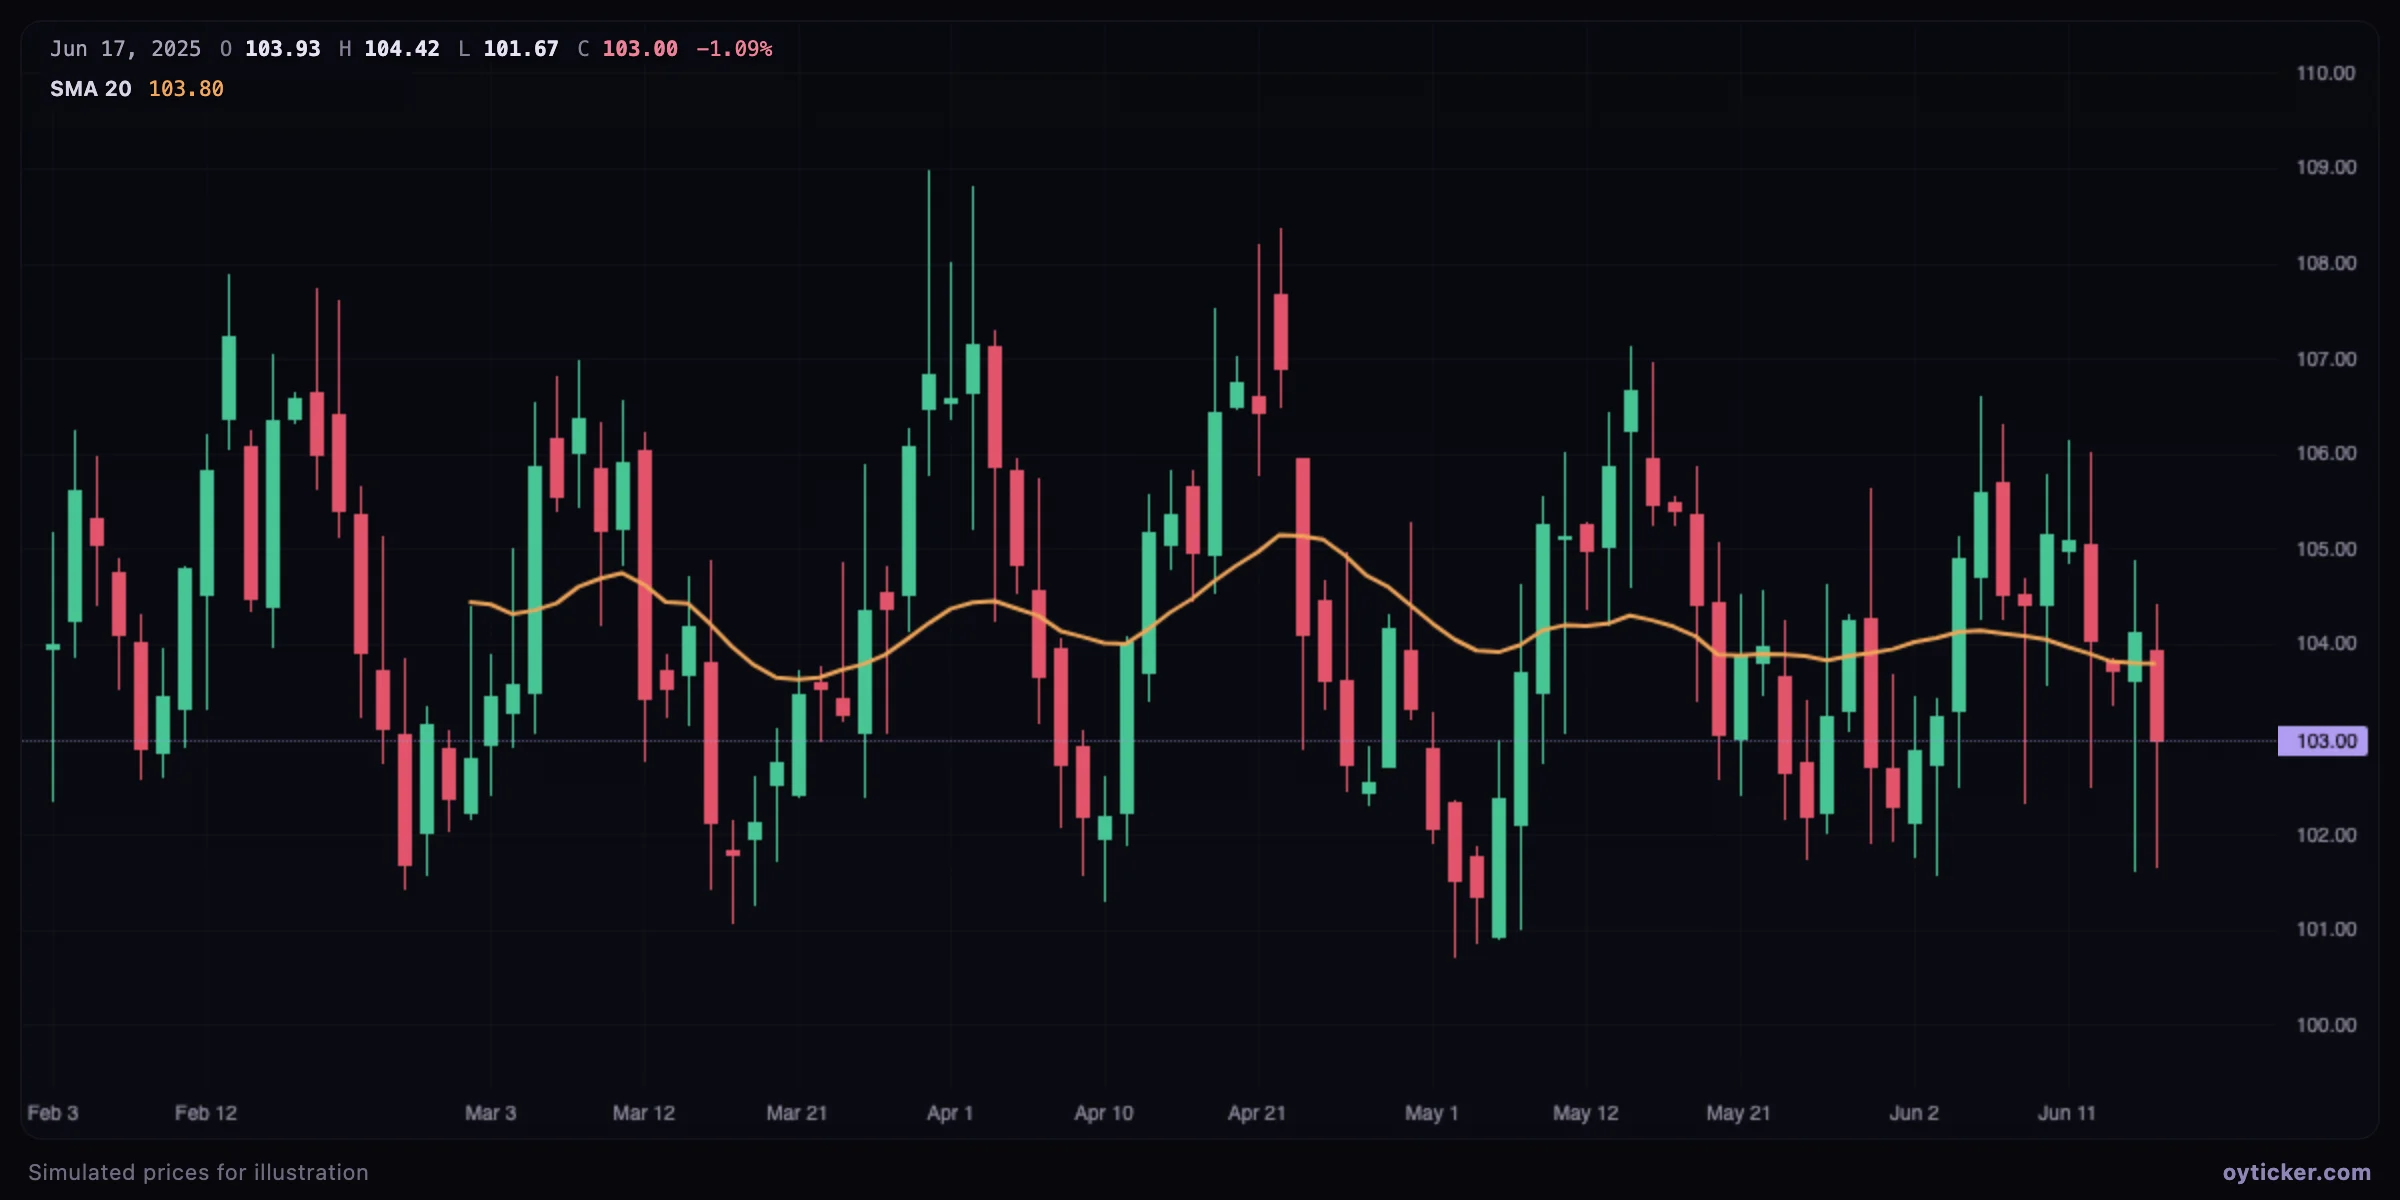
Moving averages are trend tools. When the average is flat and price keeps crossing it, the market is ranging and crossover signals should be ignored; oscillators like the RSI or range tools work better there.
Add it in Oyticker
- Click Indicators, choose Moving average.
- Click its name in the legend to set the type, length and source; add it several times for several averages (each gets its own color).
Limits
- Every average lags: shorter lengths and EMAs lag less but give more false signals.
- No length is “the right one”; widely watched values (20, 50, 100, 200) matter because many participants use them.
Charts in this guide use simulated prices generated for illustration; levels and outcomes shown are examples, not observations of a real market. Educational content only, not investment advice.