
How it is calculated
For the closes y of the bars between the two points, numbered x = 0 … n−1, the line minimizes the sum of squared vertical distances (ordinary least squares):
slope     = (n·Σxy − Σx·Σy) / (n·Σx² − (Σx)²)
intercept = (Σy − slope·Σx) / n
σ         = √( Σ (y − line)² / n )        root mean square of the residuals
bands     = line ± k·σ                     k = 1, 1.5, 2 (default), 2.5 or 3
r         = (n·Σxy − Σx·Σy) / √((n·Σx² − (Σx)²)·(n·Σy² − (Σy)²))
Pearson's r goes from −1 to 1: near ±1 the closes follow the line closely, near 0 there is no linear trend.
The label on the chart shows r, the band distance in price (k·σ) and the number of bars used. Extend right prolongs the line and the bands into the future with the same slope.
How to read it
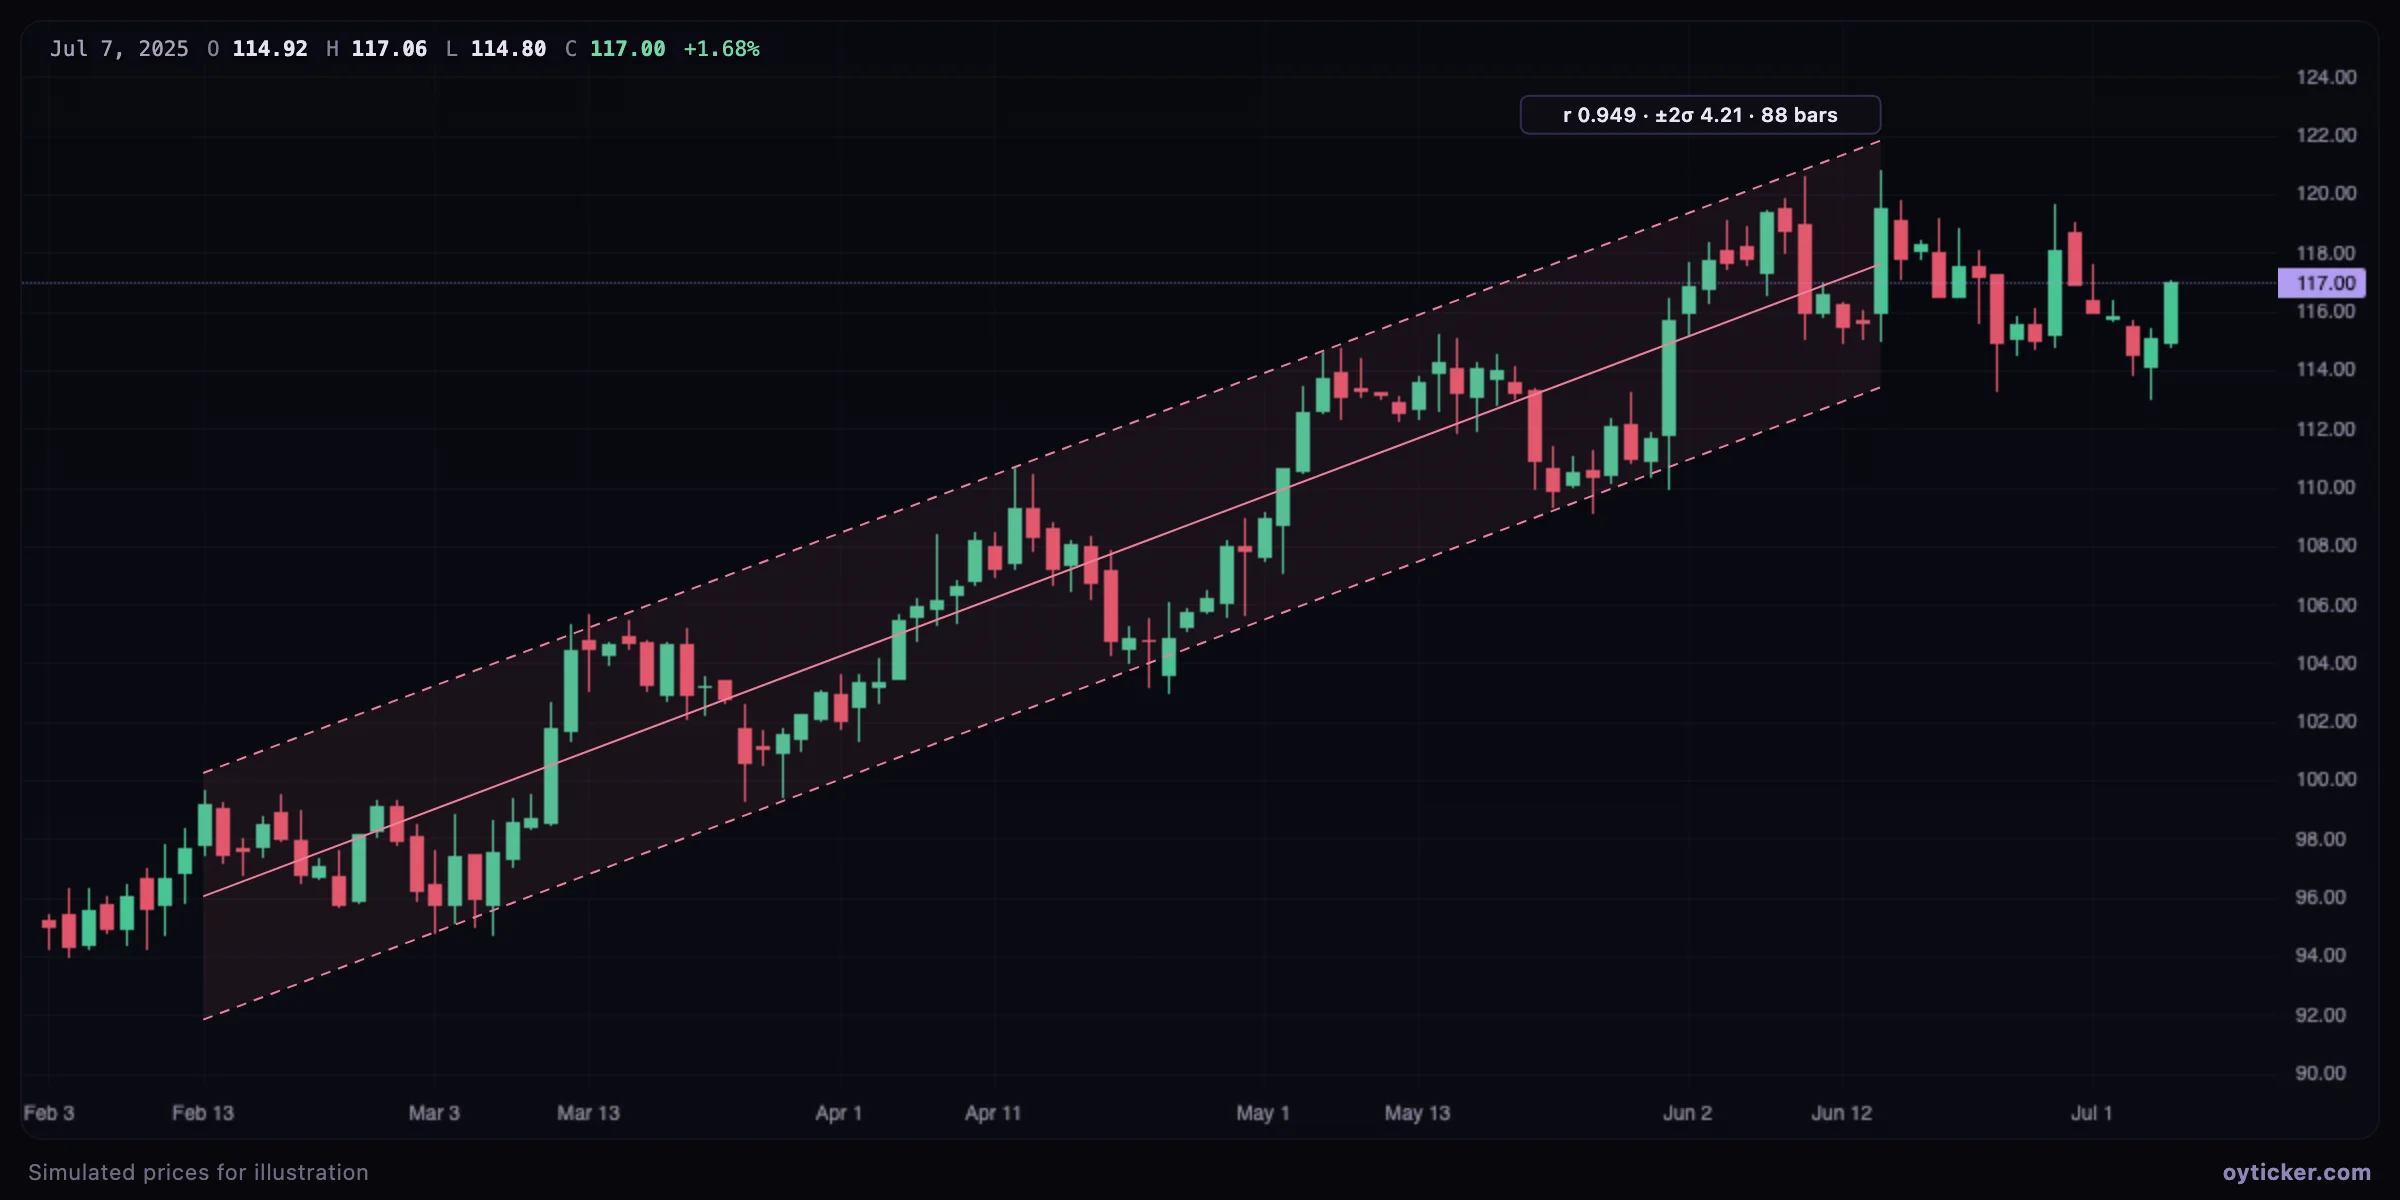
- The regression line is the trend's fair value for the period. Price oscillates around it.
- The ±2σ bands. If residuals were normally distributed, about 95% of closes would fall inside; a close outside is statistically unusual for that trend, either an exhaustion or the start of a regime change.
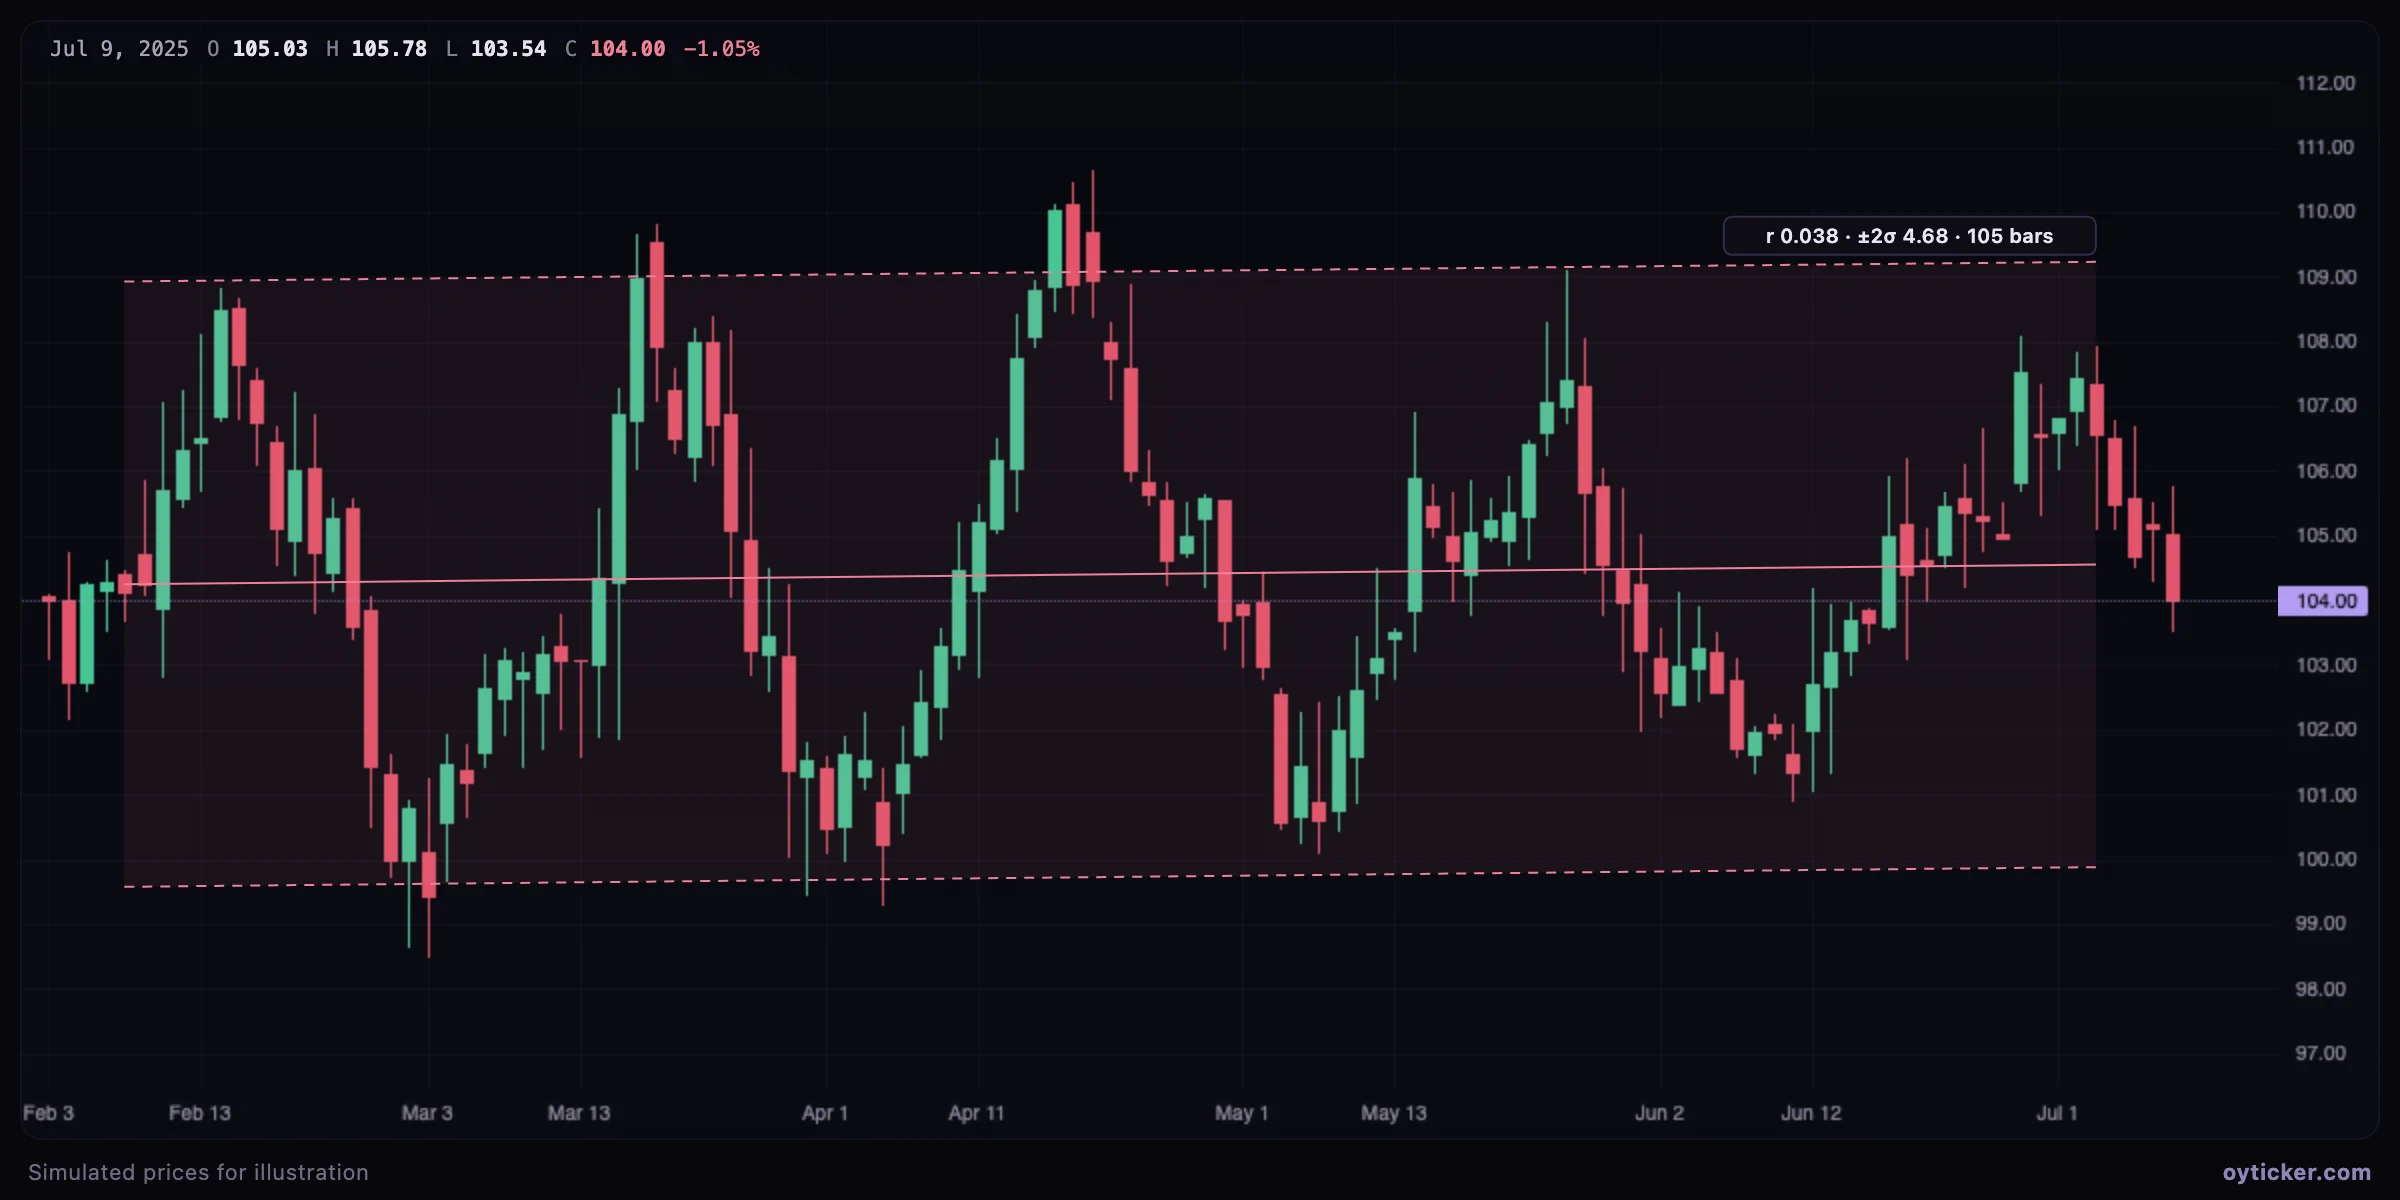
- Pearson's r measures how much of the movement the line explains. Above about 0.8 the channel is a good description of the trend; below about 0.5 it should not be used to trade a direction.
- The slope, in price per bar, is the trend's average speed; comparing slopes of successive channels shows acceleration or slowdown.
Case study: the same tool on a range
A regression line can always be computed, even when there is no trend. Pearson's r is what tells the two situations apart.
How to draw it
- Choose Channels & pitchforks → Regression channel.
- Click the first bar of the period, then the last one. The handles sit on the regression line.
- In the options, choose the band width (±1σ to ±3σ) and tick Extend right to project it.
Start the period at a clear change of trend (a major low or high). A period that mixes two regimes gives a low r and a meaningless slope.
Charts in this guide use simulated prices generated for illustration; levels and outcomes shown are examples, not observations of a real market. Educational content only, not investment advice.