Custom indicators let you write your own formulas in a small language close to TradingView's Pine Script. Formulas compute numbers only: they cannot run code, read data or send anything, which makes indicators shared by other users safe to import.
What it's for
Build indicators that Oyticker does not offer, in a formula language close to Pine Script.
Save them, reuse them and share them safely as code.
Hull, Keltner, Donchian, OBV, CCI, Williams %R, Momentum, ROC
Sharing
Copy and import as code
The editor
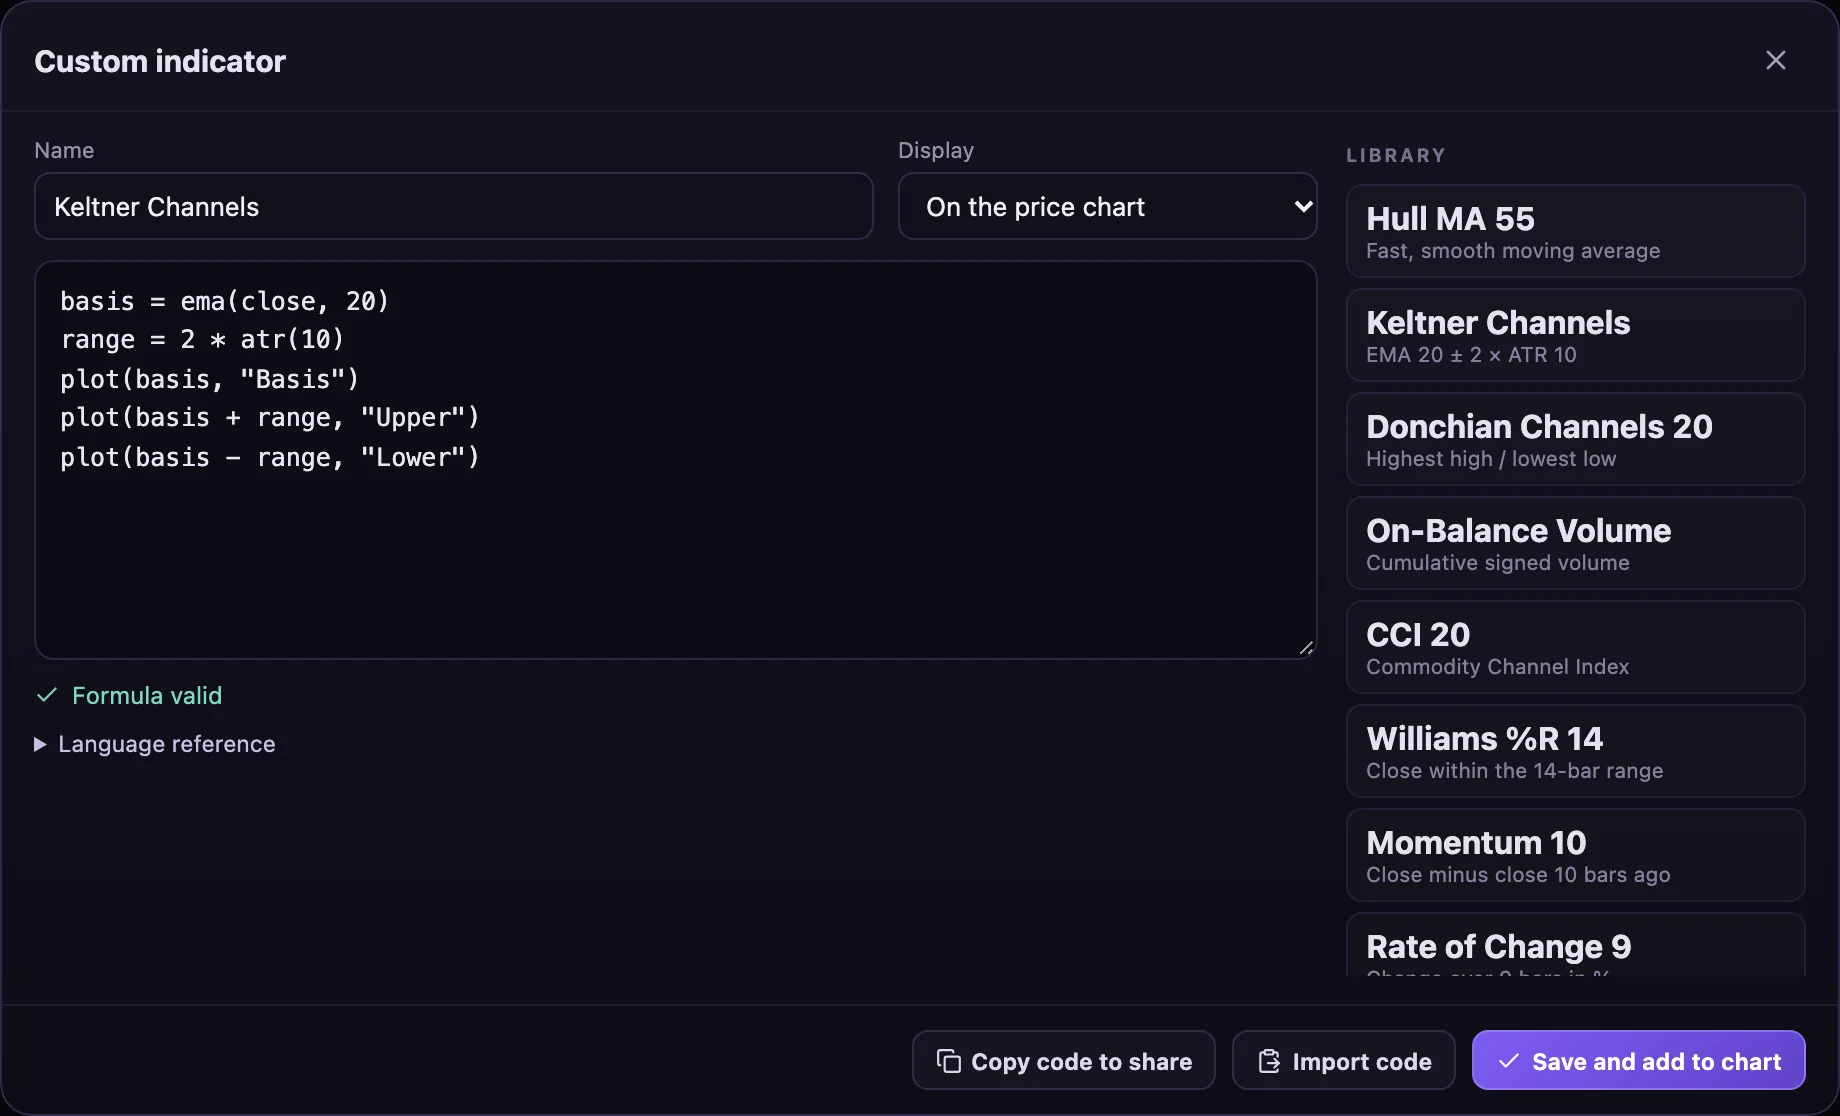
The editor: a name, where to display it, the formula with live validation, and a library of ready-made indicators. Formulas can be saved and shared as code.
Click Indicators → Custom indicator.
Pick an example from the library or write a formula; the status line shows errors with their line number as you type.
Choose On the price chart or In its own pane, then Save and add to chart.
Copy code to share gives a code another Oyticker user can paste in Import code.
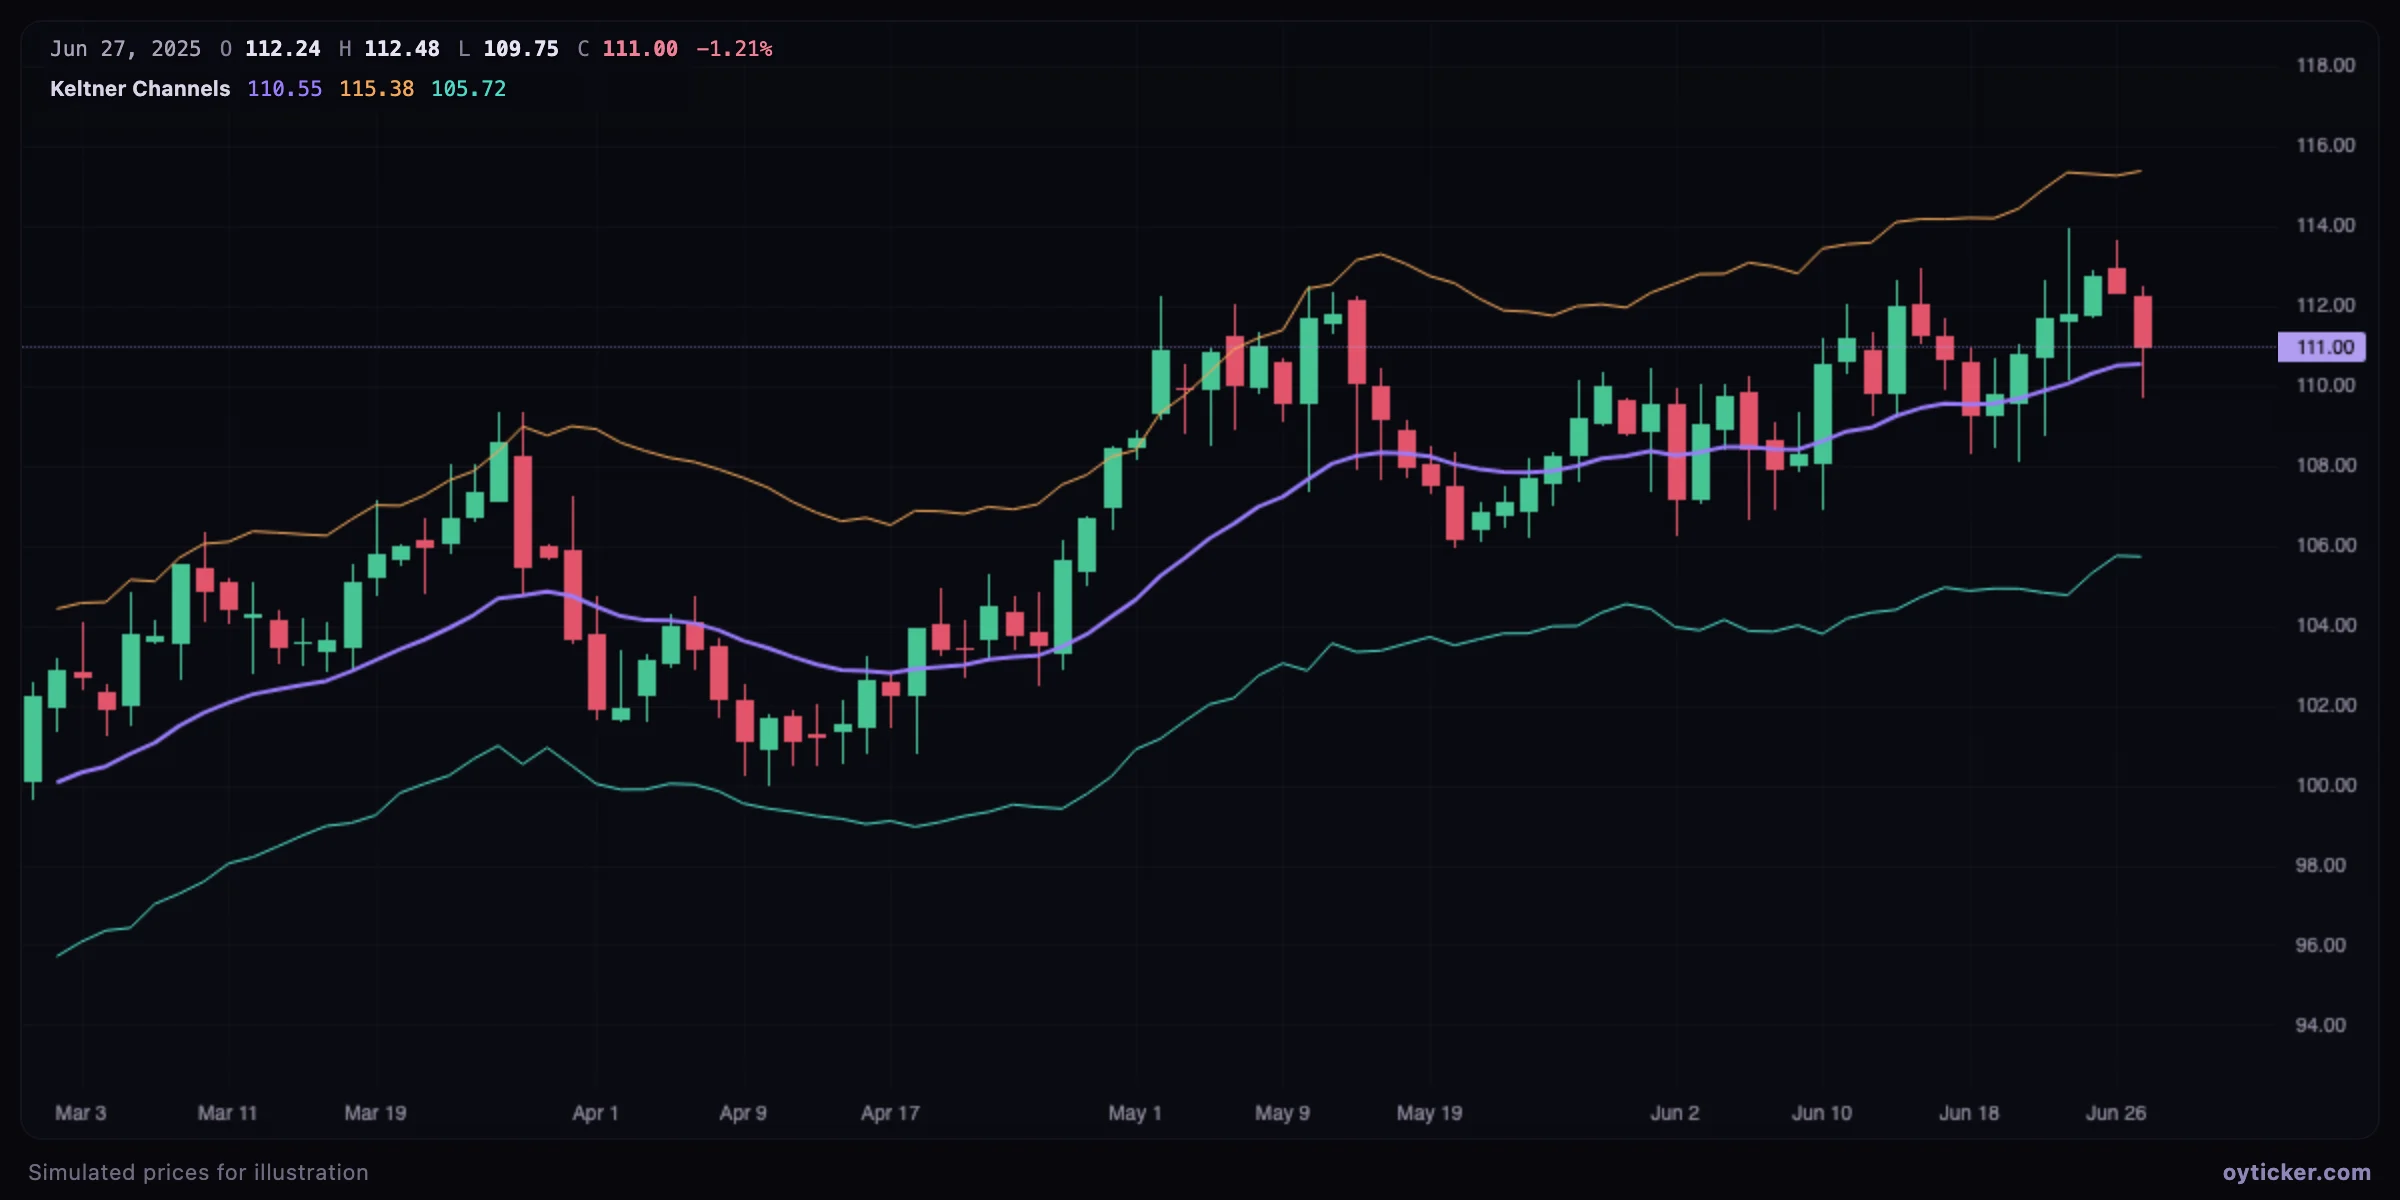
The Keltner Channels example on the chart: an EMA 20 with bands at 2 × ATR(10).
close[1] is the previous close, x[n] the value n bars ago
Operators
+ - * / % ^, comparisons > < >= <= == !=, and or not (or && || !), cond ? a : b
Plots
plot(x, "Title", "#hex color"), at most 8 per indicator
Levels
hline(70, "Title")
Constants
na, true, false, pi, e
Comments
// anything after two slashes
Function
Meaning
sma(x, n)ema(x, n)wma(x, n)rma(x, n)hma(x, n)
Moving averages (rma = Wilder's)
stdev(x, n)dev(x, n)
Standard deviation, mean absolute deviation
highest(x, n)lowest(x, n)sum(x, n)cum(x)
Rolling extremes, sums
change(x, n)roc(x, n)
Difference and % change over n bars
rsi(x, n)atr(n)tr()vwap()
Built-in indicators (session VWAP)
crossover(a, b)crossunder(a, b)
1 on the bar a crosses above (below) b
nz(x, v)maxminabssignsqrtlogexppowround
Utilities
// On-Balance Volume, as in the library
plot(cum(nz(sign(change(close))) * volume), "OBV")

// Bandwidth of Bollinger Bands, in %
basis = sma(close, 20)
plot(100 * 4 * stdev(close, 20) / basis, "BB width %")
Limits and safety
Formulas are parsed and evaluated by Oyticker, never executed as code: only the functions above exist, and nothing can access the page, your account or the network.
Limits: 4,000 characters, 40 statements, lengths from 1 to 1,000 bars, at most 8 plots.
Unavailable values (before enough bars exist, divisions by zero) are na and are not drawn.
Saved formulas are stored in your browser for your account; they are not sent to Oyticker's servers.
Charts in this guide use simulated prices generated for illustration; levels and outcomes shown are examples, not observations of a real market. Educational content only, not investment advice.