
The five lines
| Line | Calculation | Plotted |
|---|---|---|
| Conversion (Tenkan-sen) | (highest high + lowest low) / 2 over 9 bars | On the current bar |
| Base (Kijun-sen) | (highest high + lowest low) / 2 over 26 bars | On the current bar |
| Leading span A (Senkou A) | (Tenkan + Kijun) / 2 | 25 bars ahead |
| Leading span B (Senkou B) | (highest high + lowest low) / 2 over 52 bars | 25 bars ahead |
| Lagging span (Chikou) | Close | 25 bars back |
The cloud is the area between spans A and B: green when A is above B, red otherwise. As on TradingView, the shift is the displacement minus one (25 bars for a displacement of 26), because the current bar counts as the first one.
How to read it
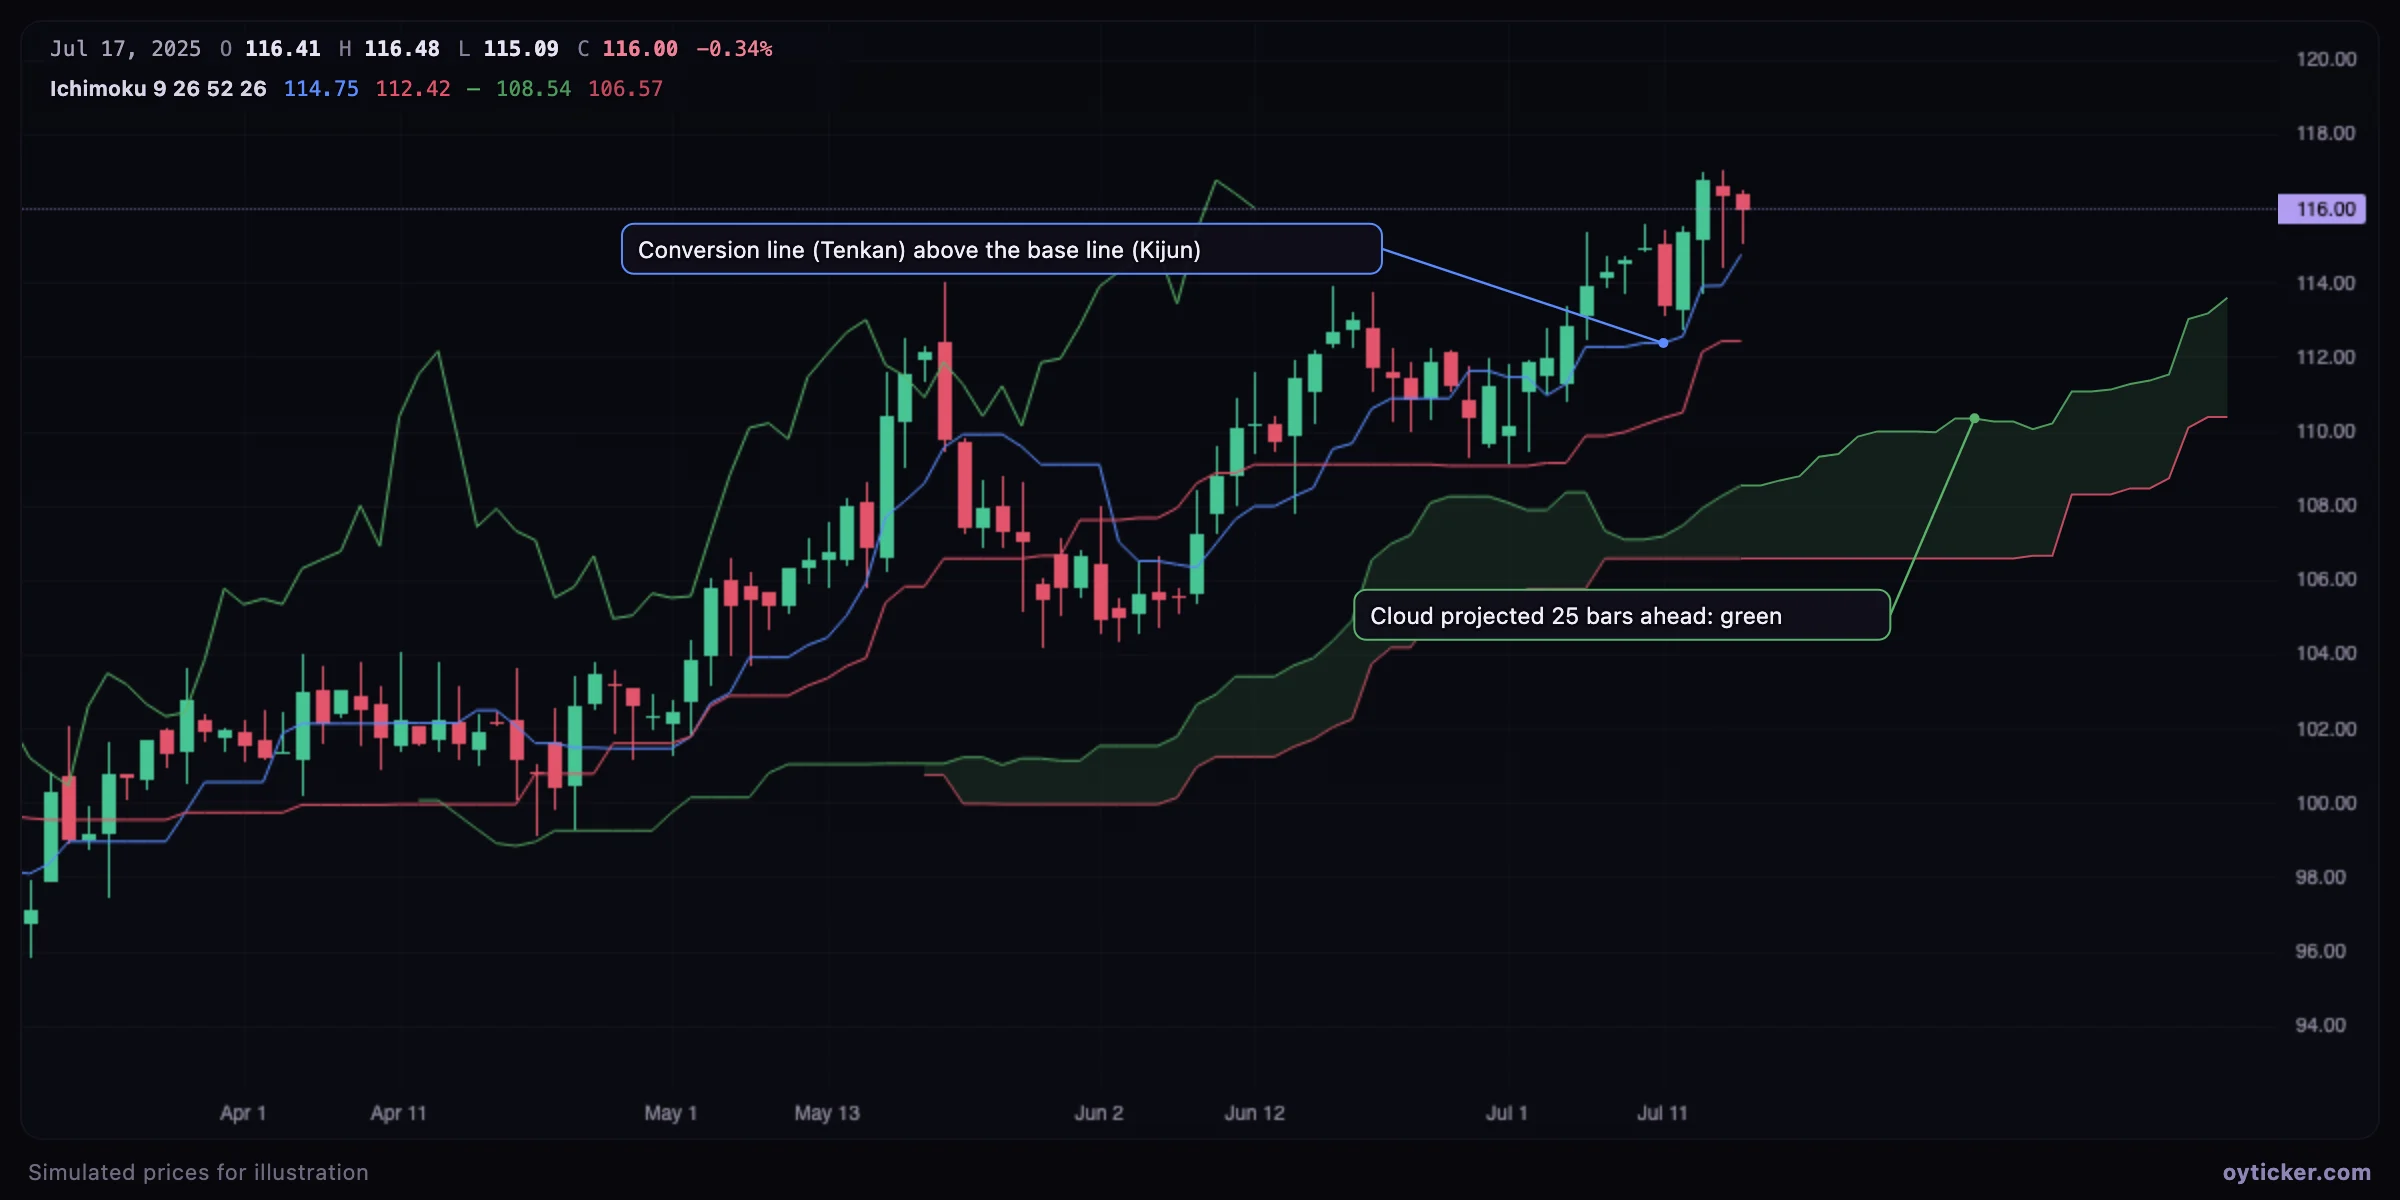
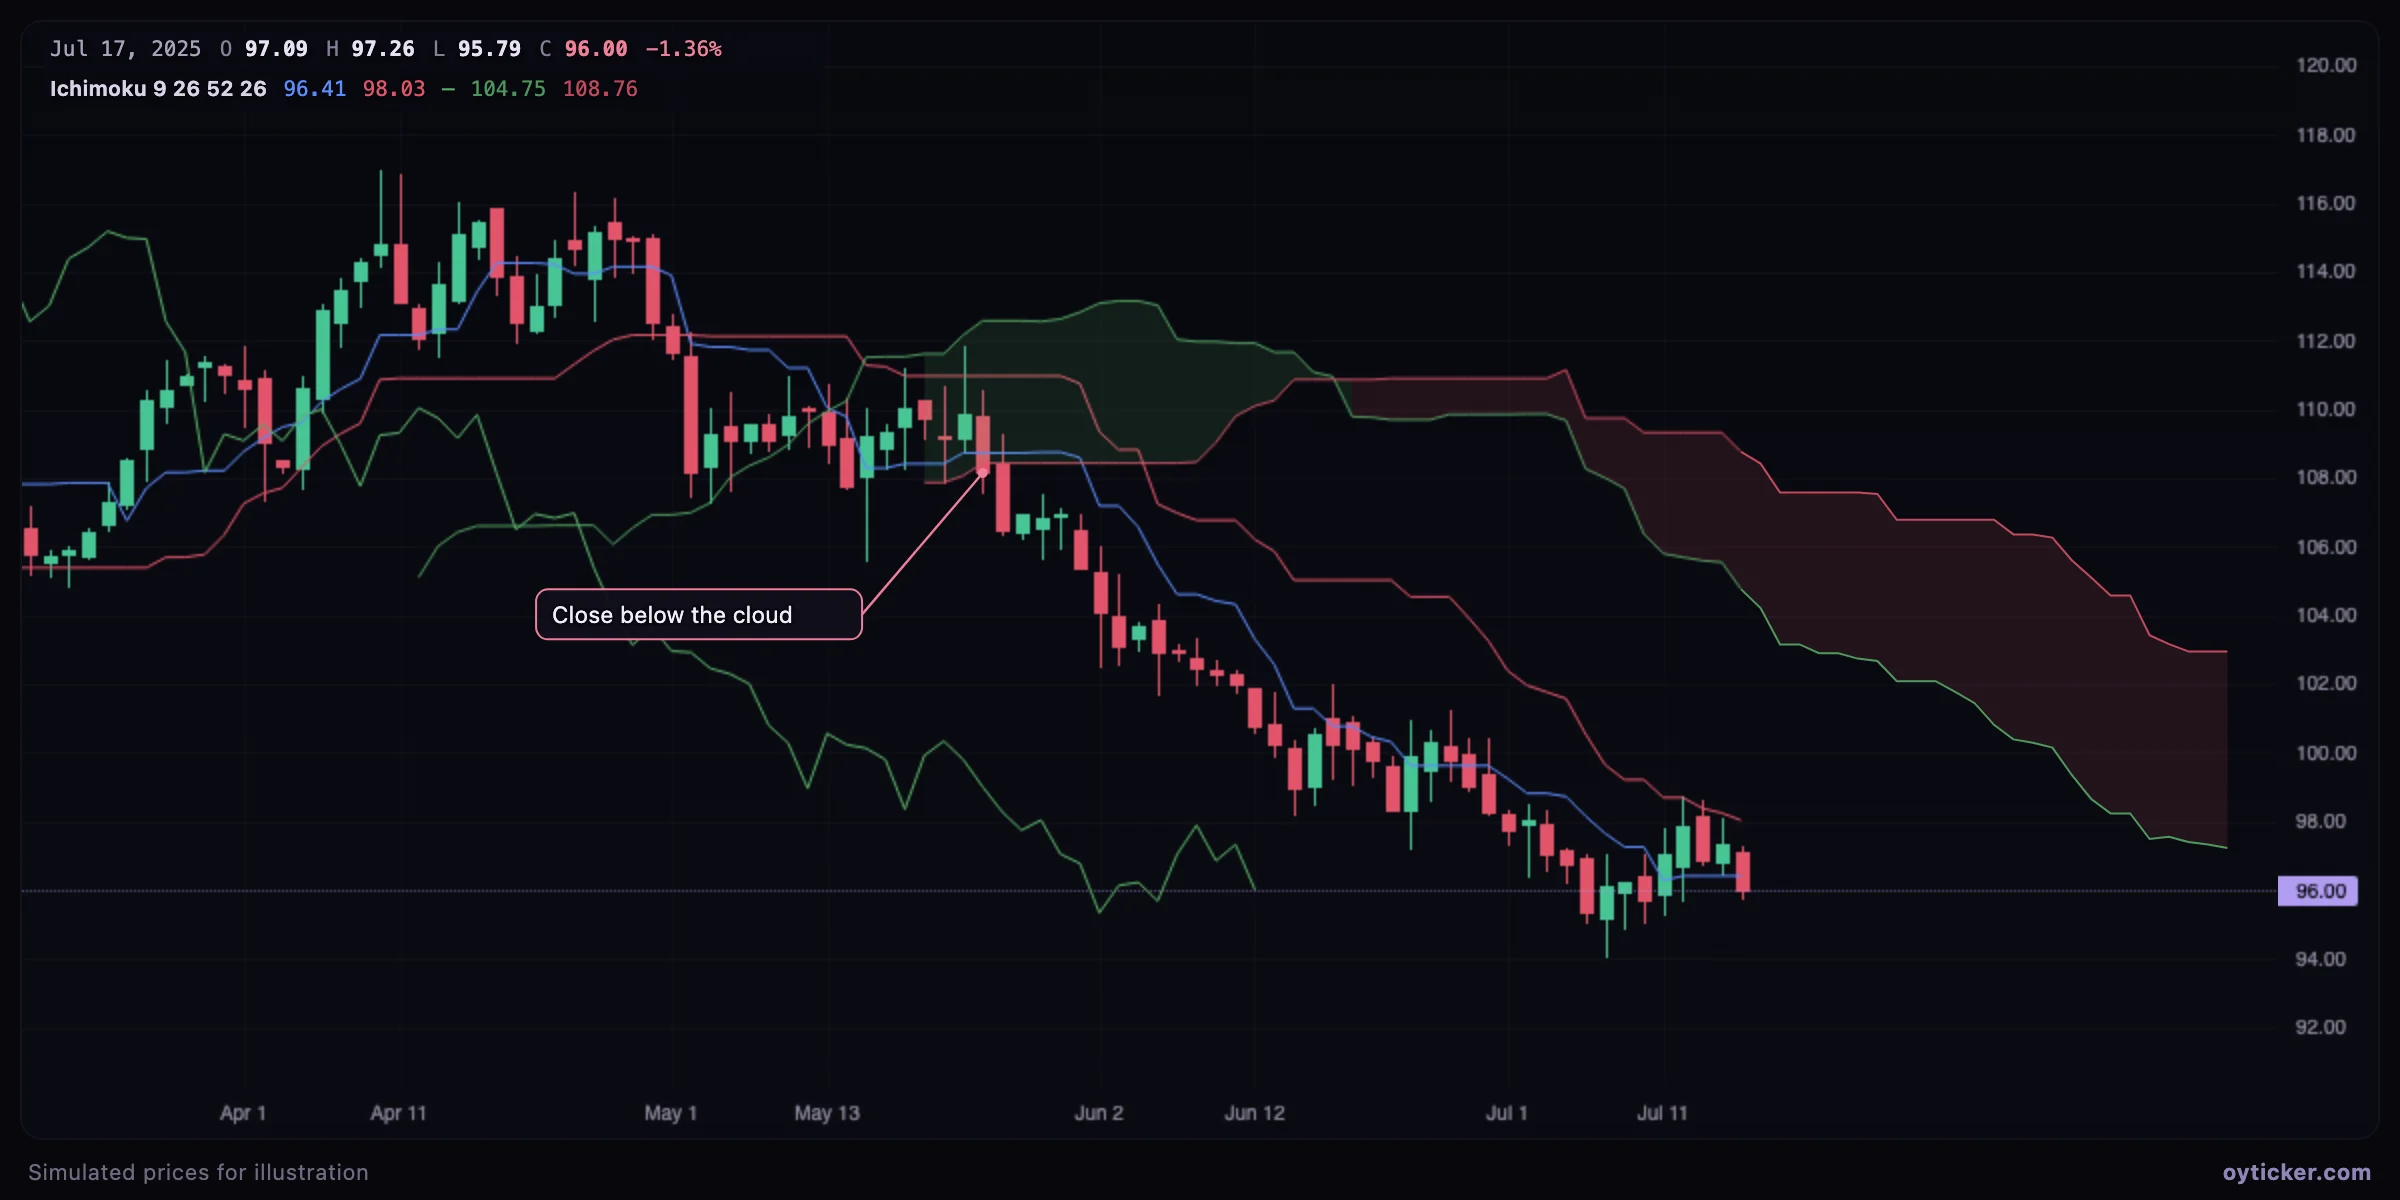
- Trend: price above the cloud is bullish, below is bearish, inside is neutral.
- Momentum: Tenkan above Kijun is bullish; their crossing is the classic “TK cross”, stronger when it happens above the cloud.
- Support and resistance: the Kijun and the cloud's edges act as dynamic levels; a thick cloud is stronger than a thin one.
- Future cloud: its color and thickness 25 bars ahead show the trend implied by current prices.
- Lagging span: above the price of 25 bars earlier confirms the trend; inside past price action means congestion.
Case study: a break below the cloud
Limits
- The default 9/26/52 settings come from a six-day trading week in 1930s Japan; some traders adapt them, but the defaults remain the convention most participants watch.
- Ichimoku needs 52 bars to compute span B and plots 25 bars ahead: it needs history and is of little use on very short series.
- In ranges the price stays in or around a thin cloud and signals multiply.
Charts in this guide use simulated prices generated for illustration; levels and outcomes shown are examples, not observations of a real market. Educational content only, not investment advice.