
Calculation
basic upper = (high + low) / 2 + factor × ATR(10)
basic lower = (high + low) / 2 − factor × ATR(10)
the lower band can only rise while price stays above it; the upper band can only fall while price stays below it
uptrend: line = lower band, until a close below it → downtrend: line = upper band
Oyticker's implementation follows TradingView's ta.supertrend line by line. The green line is drawn in an uptrend, the red one in a downtrend.
How to read it
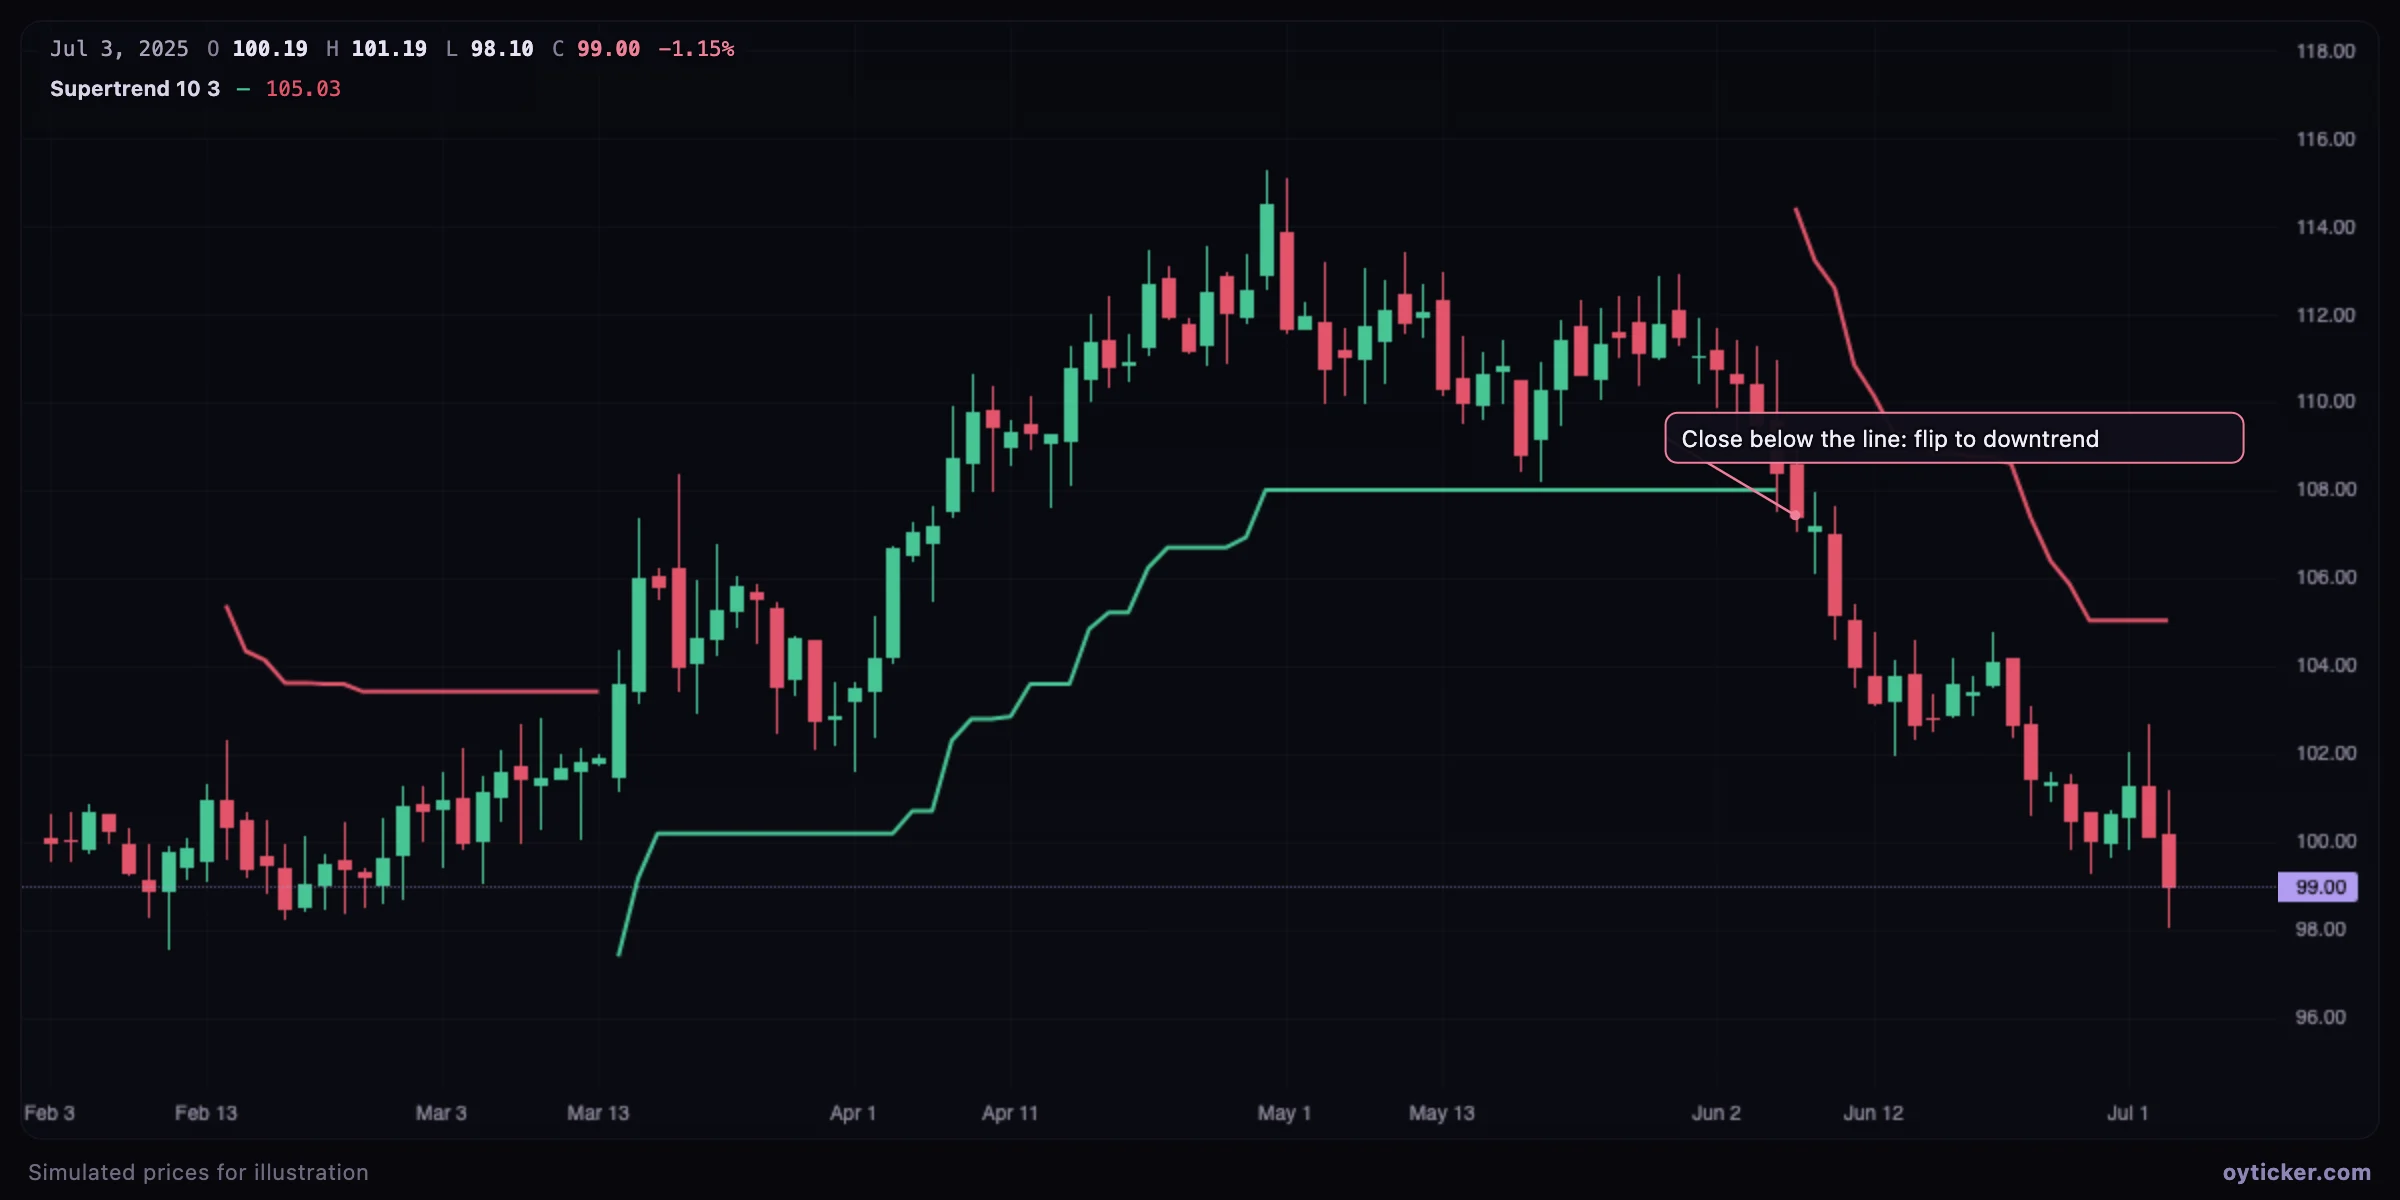
- As a trailing stop, the line is where a trend-follower would exit.
- As a trend filter, only trades in the direction of the current color are taken.
- A larger factor gives fewer flips and later exits; a smaller one reacts faster and flips more often.
Case study: whipsaws in a range
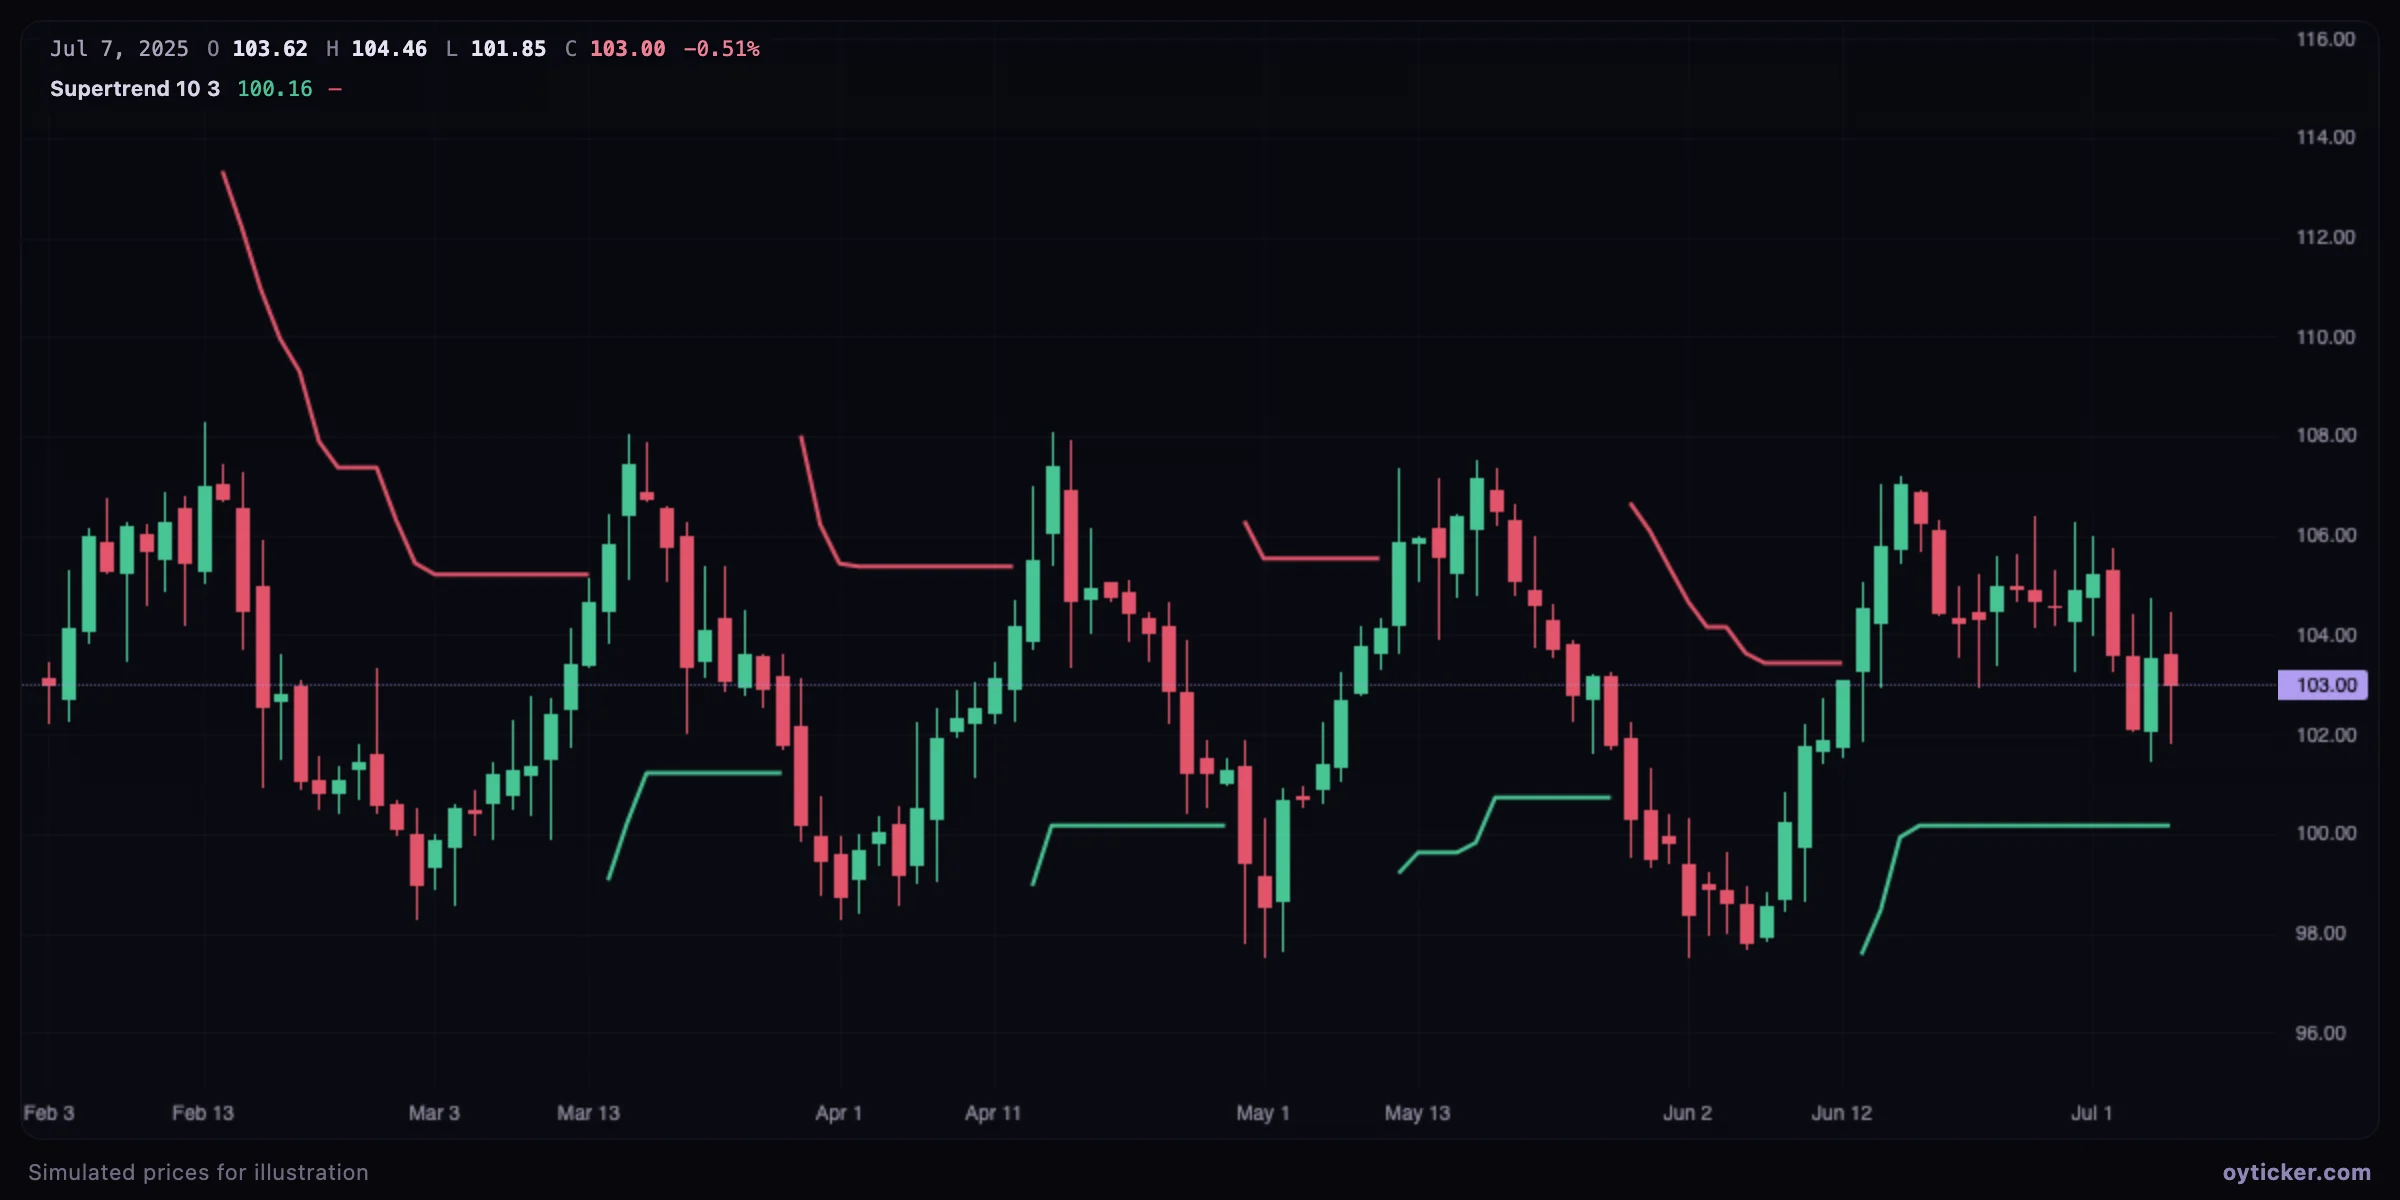
Combine it with a regime filter (a flat moving average, a narrow Bollinger Band width, or a trend-strength measure written as a custom indicator) to stand aside in ranges.
Charts in this guide use simulated prices generated for illustration; levels and outcomes shown are examples, not observations of a real market. Educational content only, not investment advice.