
Calculation
MACD line  = EMA(close, 12) − EMA(close, 26)
signal     = EMA(MACD line, 9)
histogram  = MACD line − signal
The histogram is bright when it grows away from zero and faded when it shrinks back toward zero, as on TradingView.
- MACD above zero: the 12-period EMA is above the 26-period EMA, the short-term trend is up.
- MACD above its signal (histogram positive): momentum is improving.
- Histogram shrinking: momentum is fading, often before the MACD crosses its signal.
Crossovers and the zero line
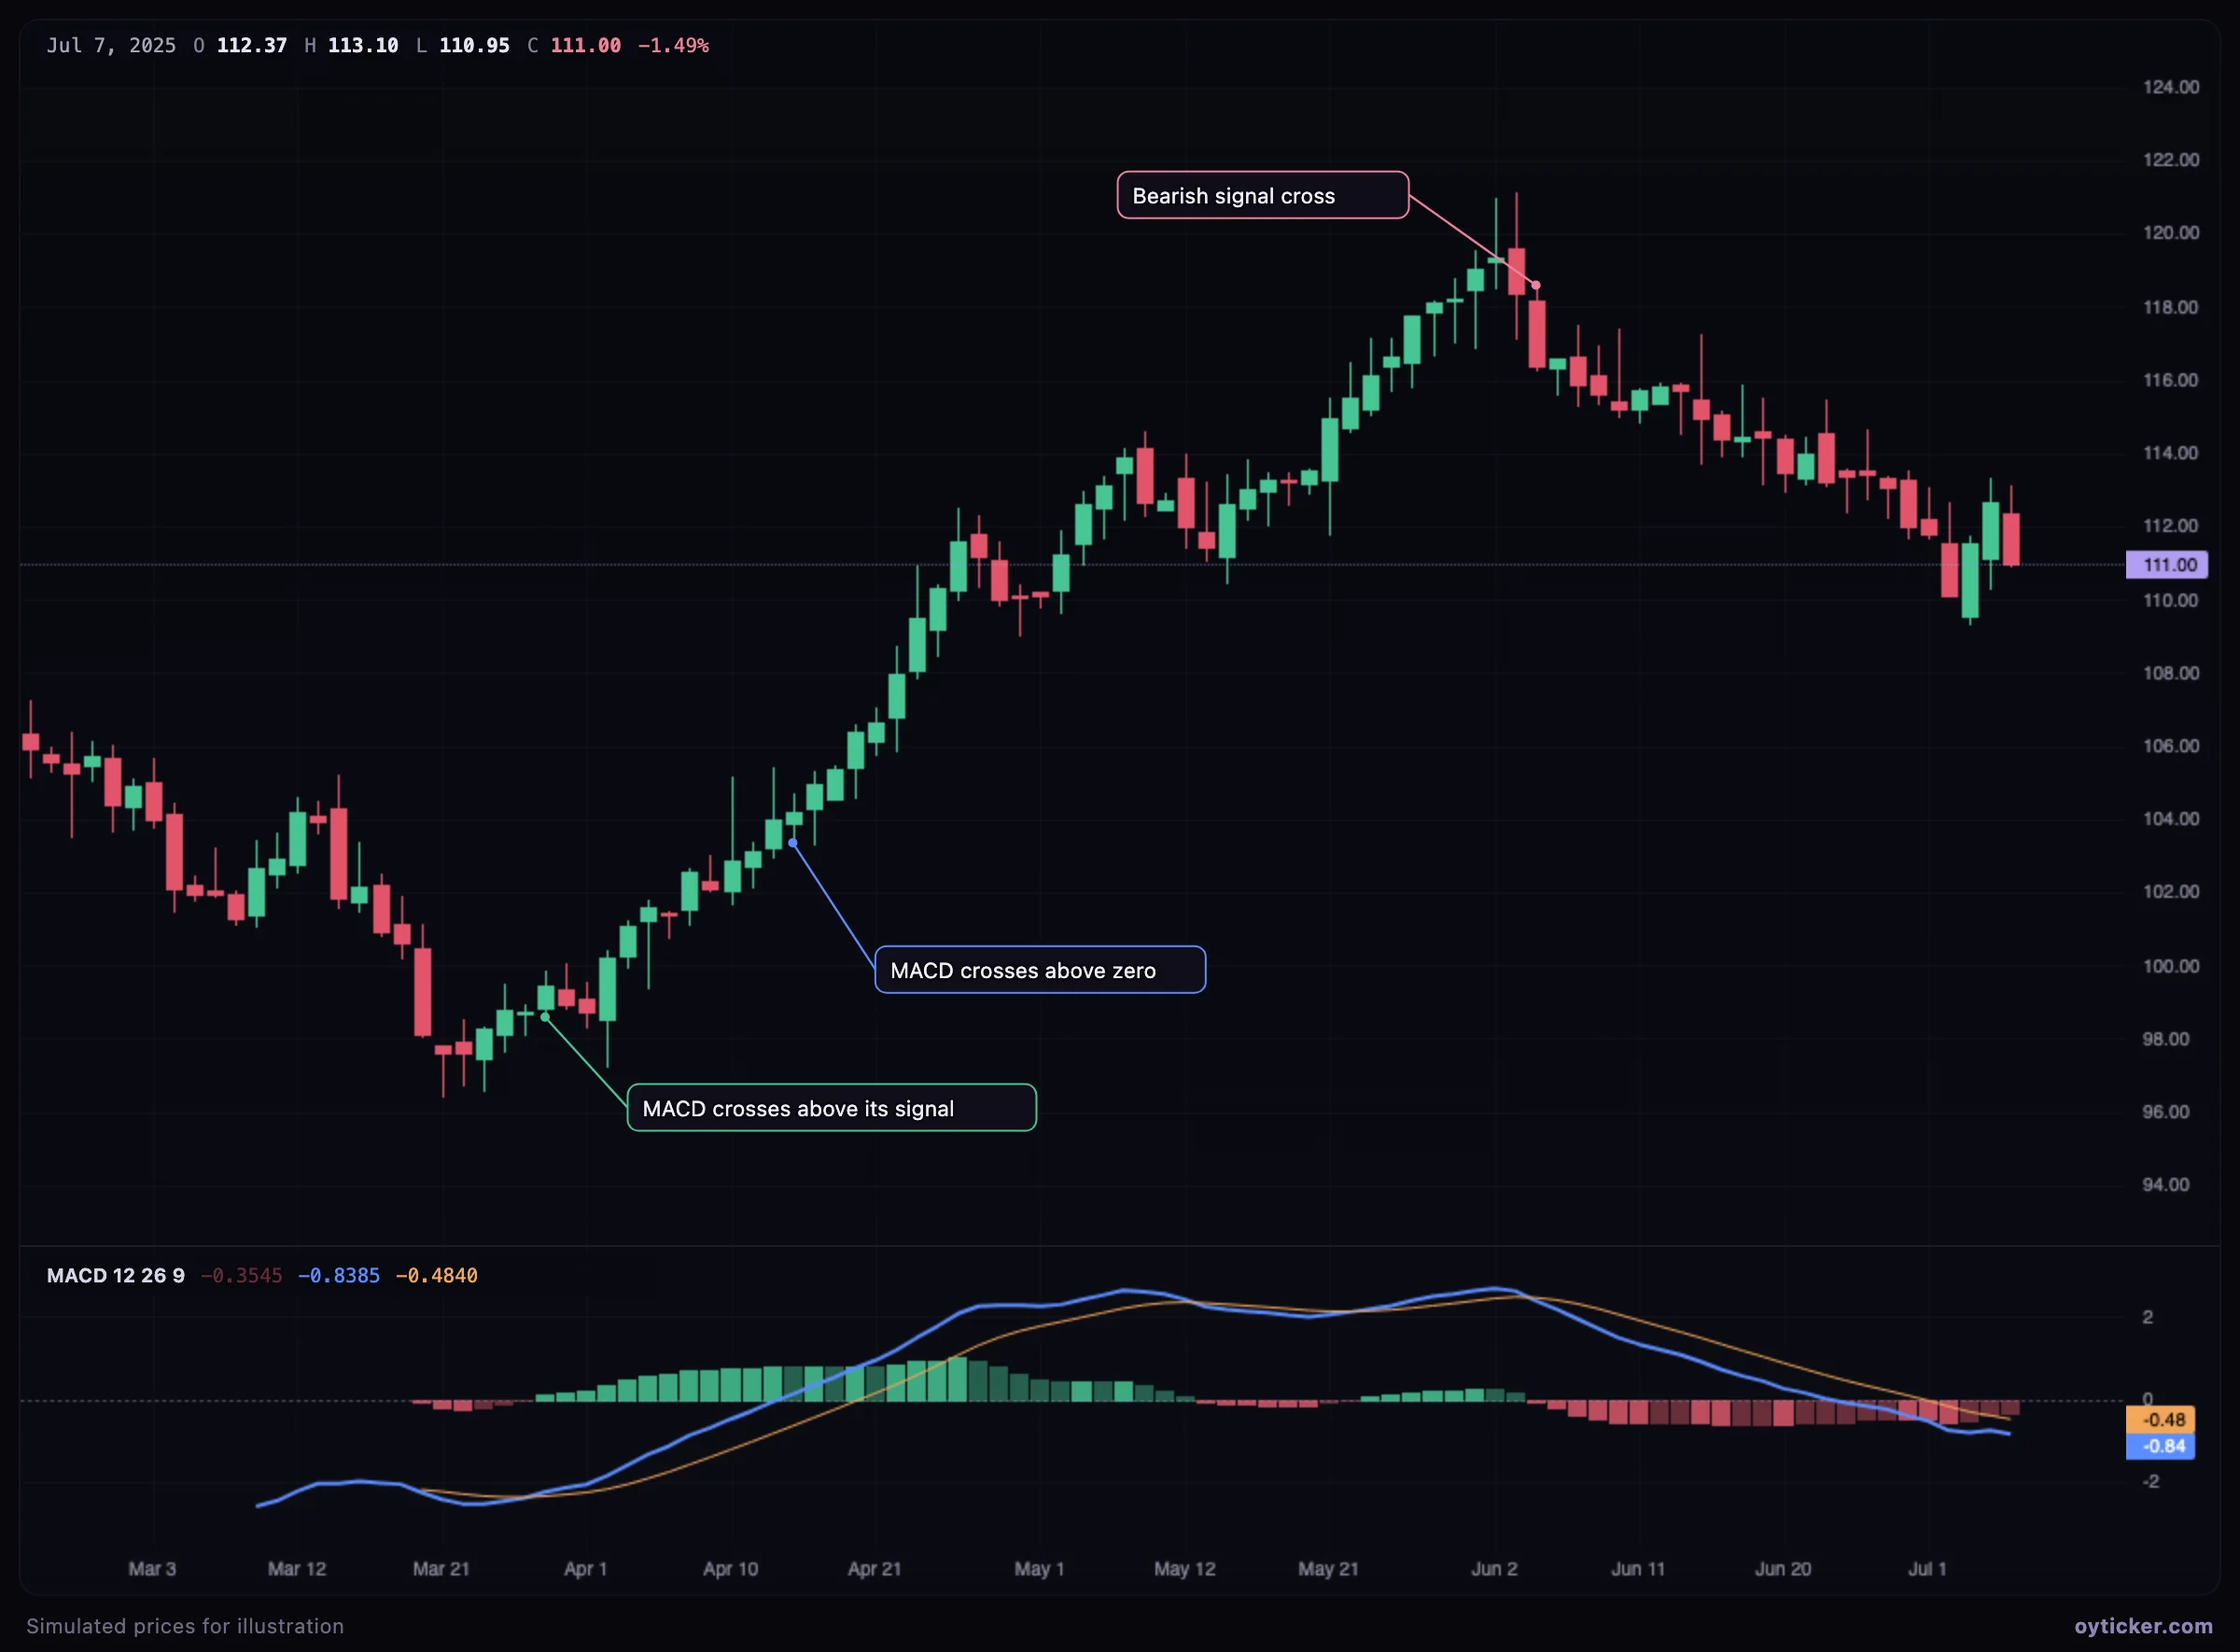
Signal-line crossovers are early but frequent; zero-line crossovers are later but describe a trend change. Many traders take signal crossovers only in the direction of the zero-line side (buy crosses above zero, sell crosses below it).
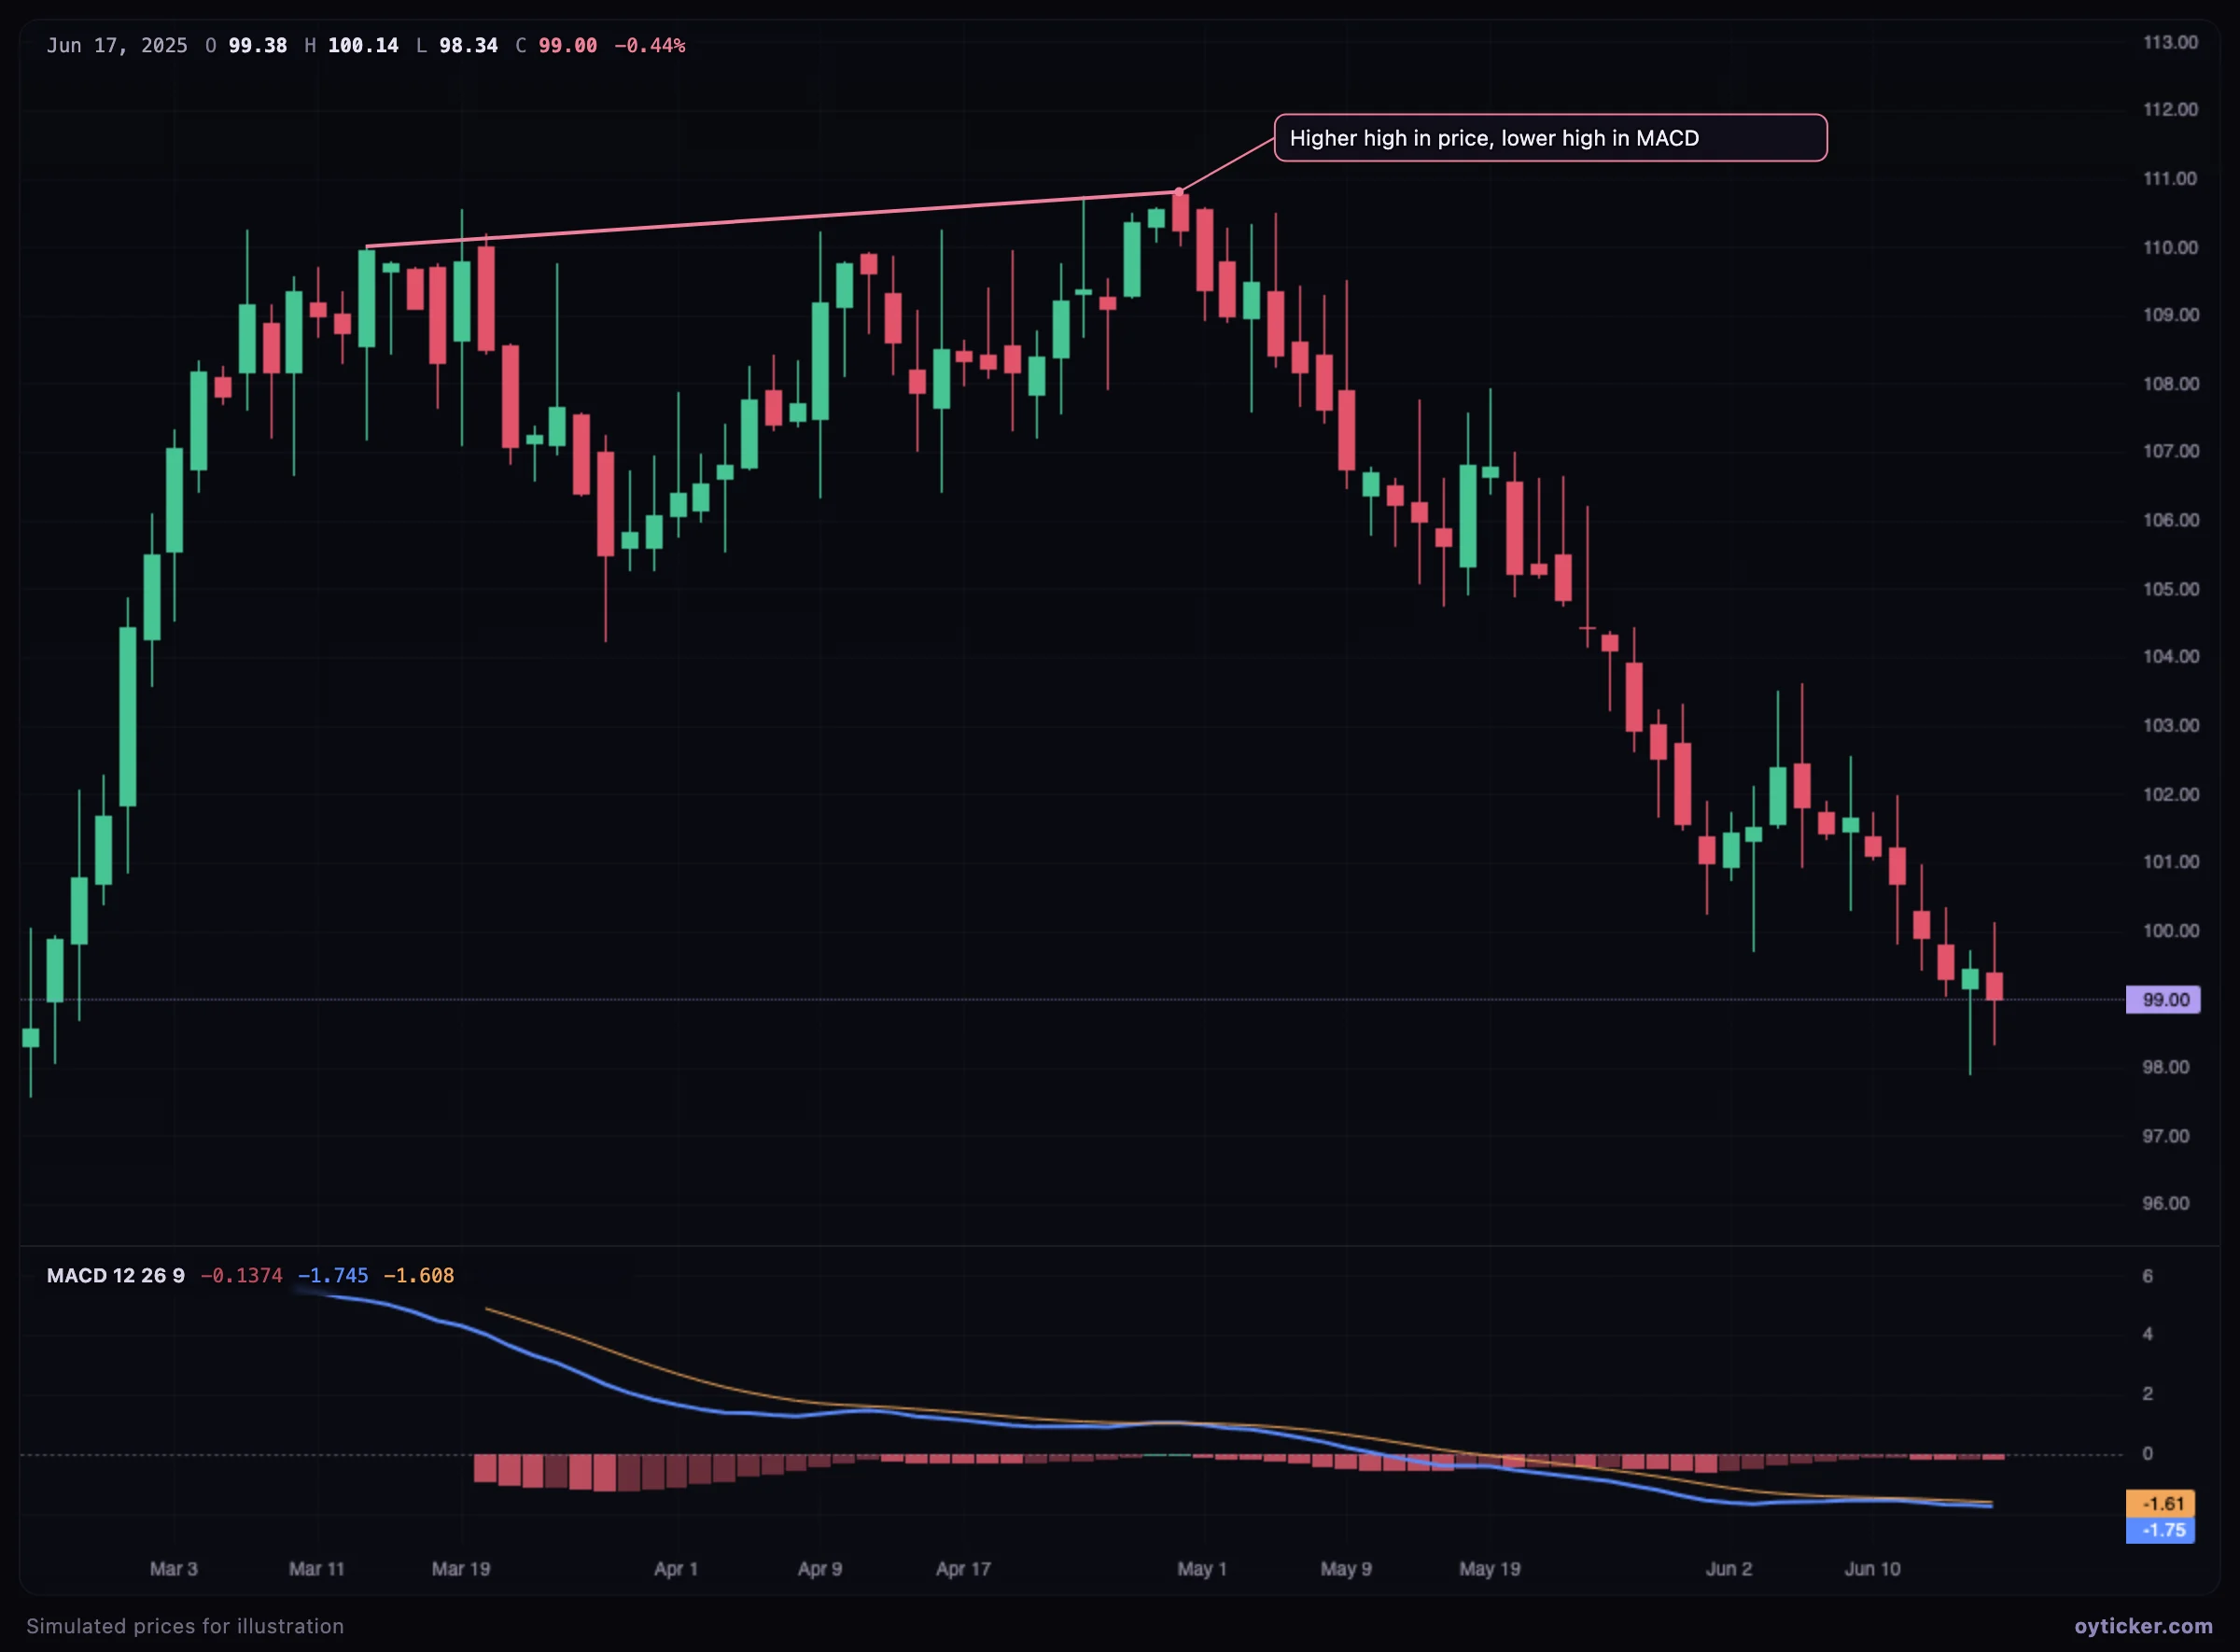
Case study: a bearish divergence
Limits
- The MACD is made of moving averages and inherits their lag and their whipsaws in ranges.
- Its values are in price units: they cannot be compared between assets or between very different price levels of the same asset.
- It needs about 34 bars of data before the signal line exists (26 for the slow EMA plus 9 for the signal).
Charts in this guide use simulated prices generated for illustration; levels and outcomes shown are examples, not observations of a real market. Educational content only, not investment advice.