
Calculation
StochRSI = 100 × (RSI − lowest RSI over 14) / (highest RSI over 14 − lowest RSI over 14)
%K = SMA(StochRSI, 3)
%D = SMA(%K, 3)
RSI is the 14-period Wilder RSI of the close, as in the RSI guide.
How to read it
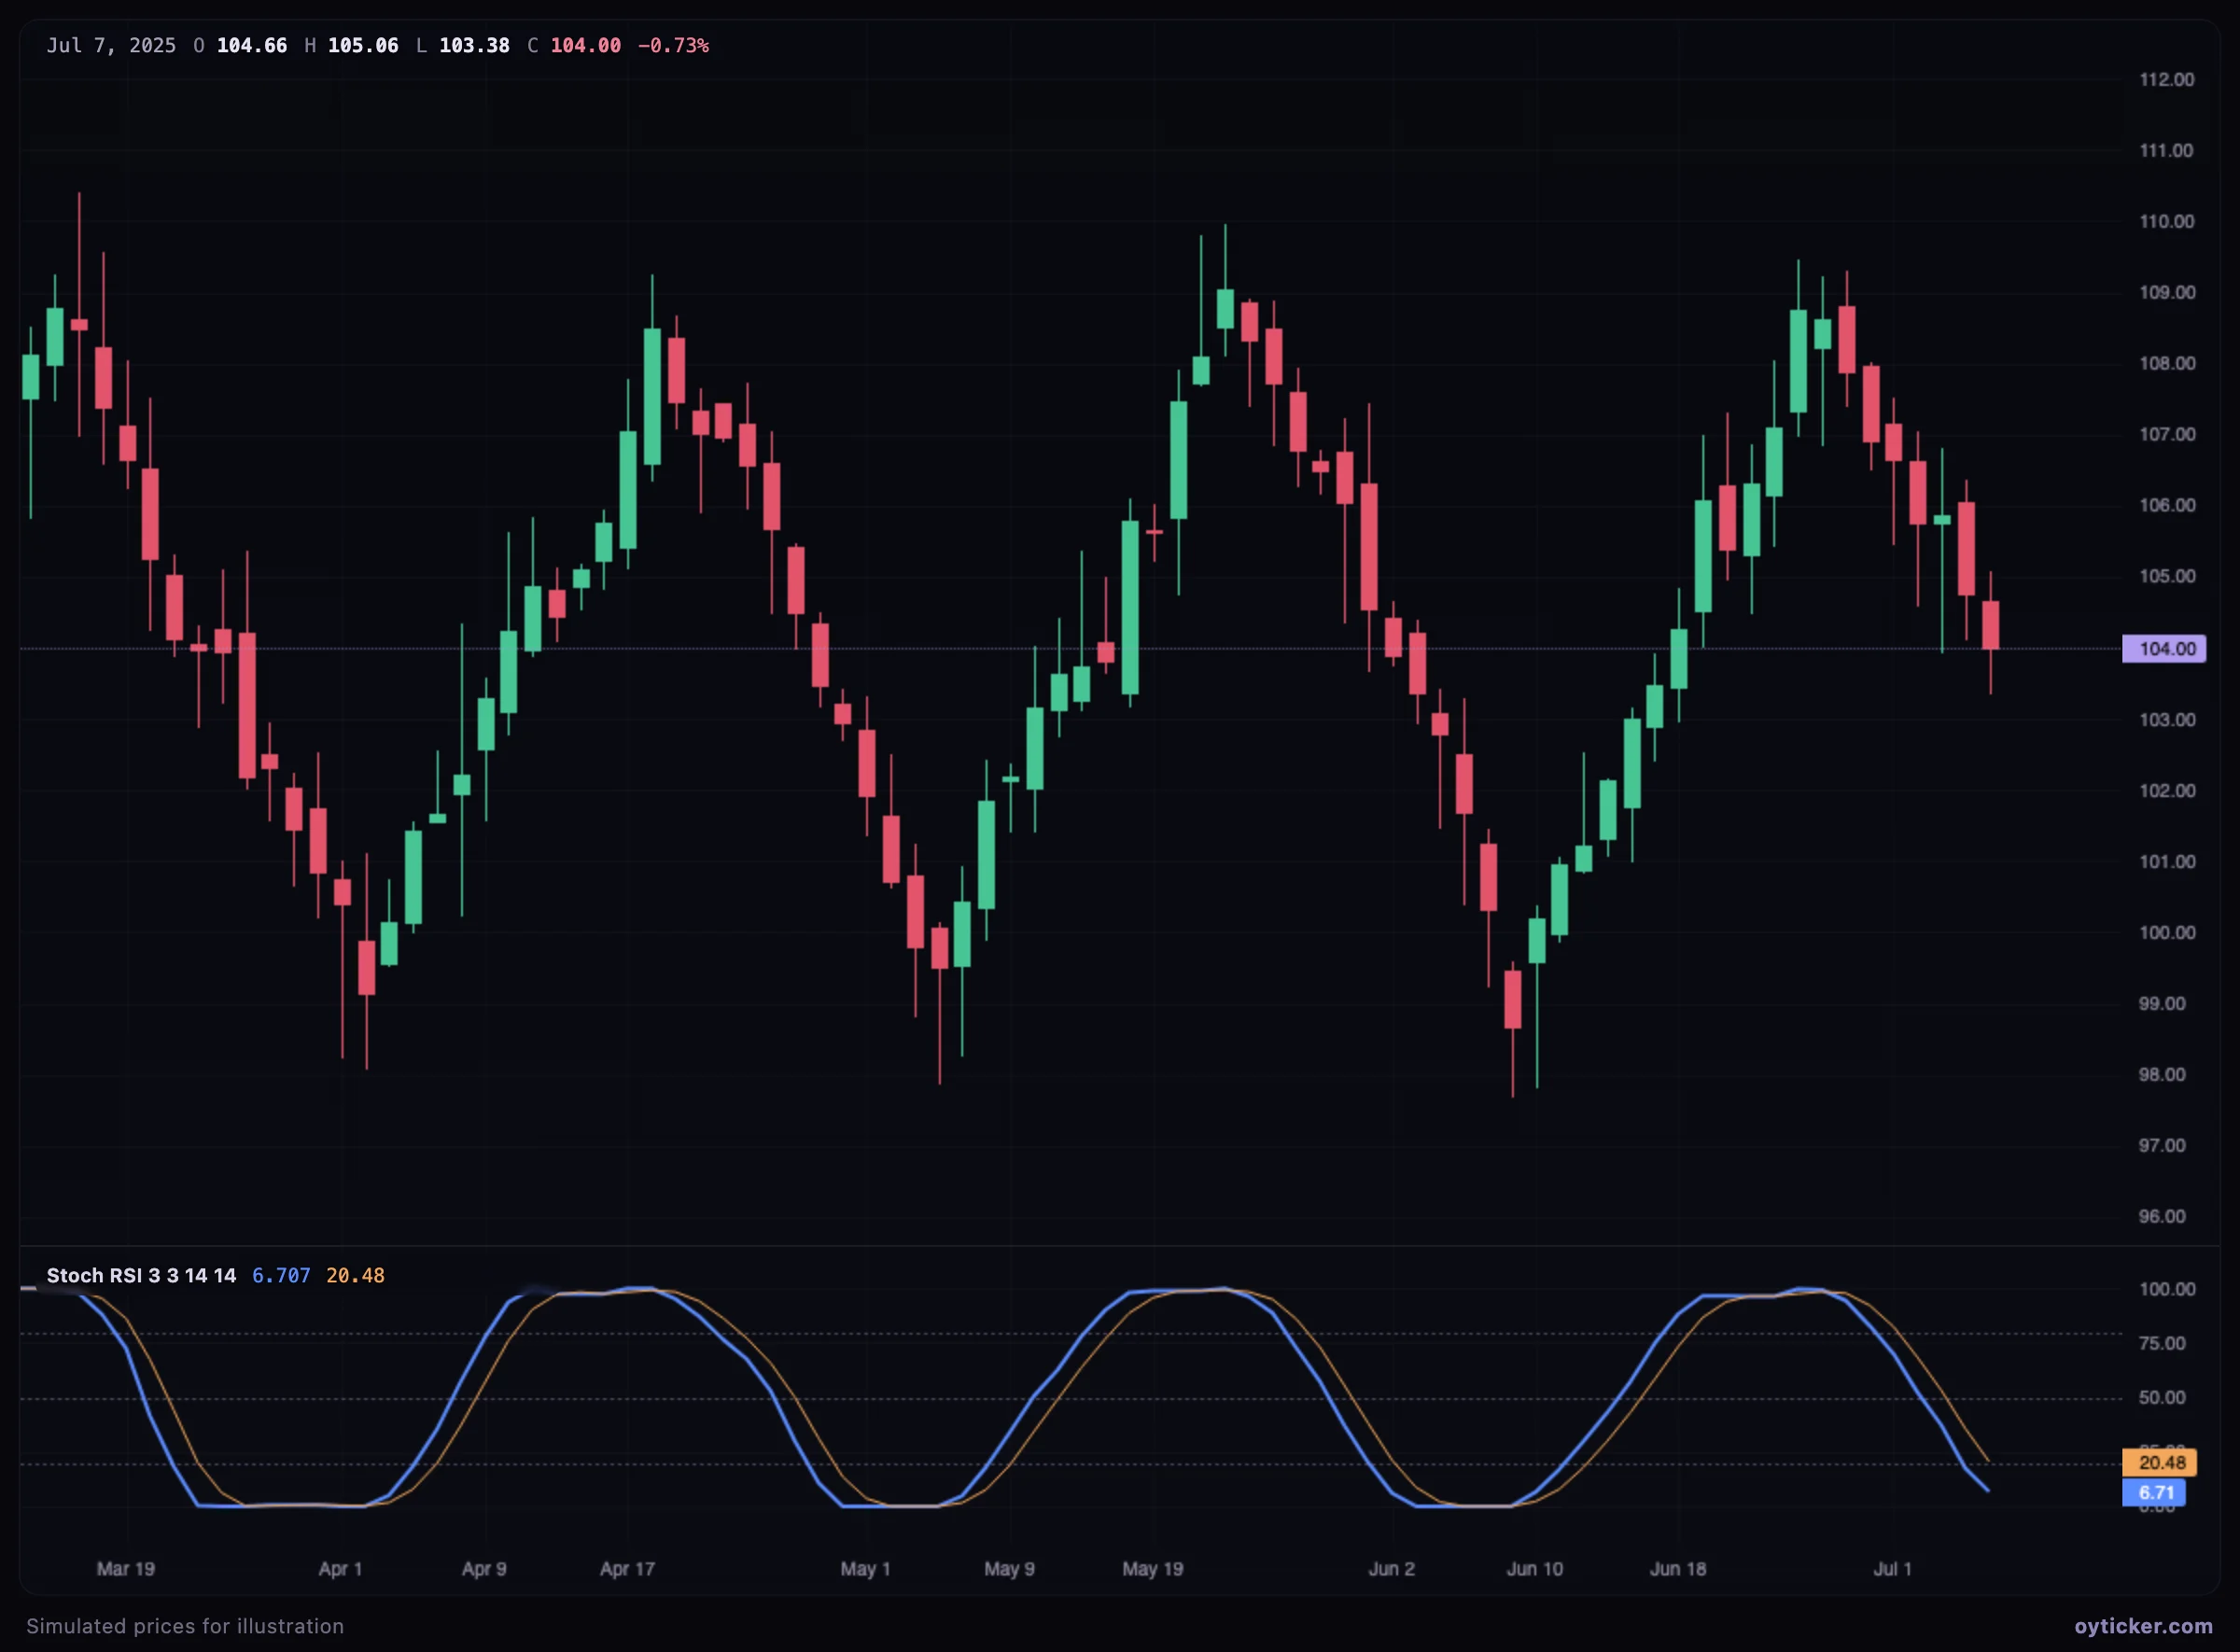
- Below 20, %K crossing above %D: momentum turns up from an oversold zone.
- Above 80, %K crossing below %D: momentum turns down from an overbought zone.
- Use it in the direction of the higher-timeframe trend: oversold crosses in an uptrend are pullback entries.
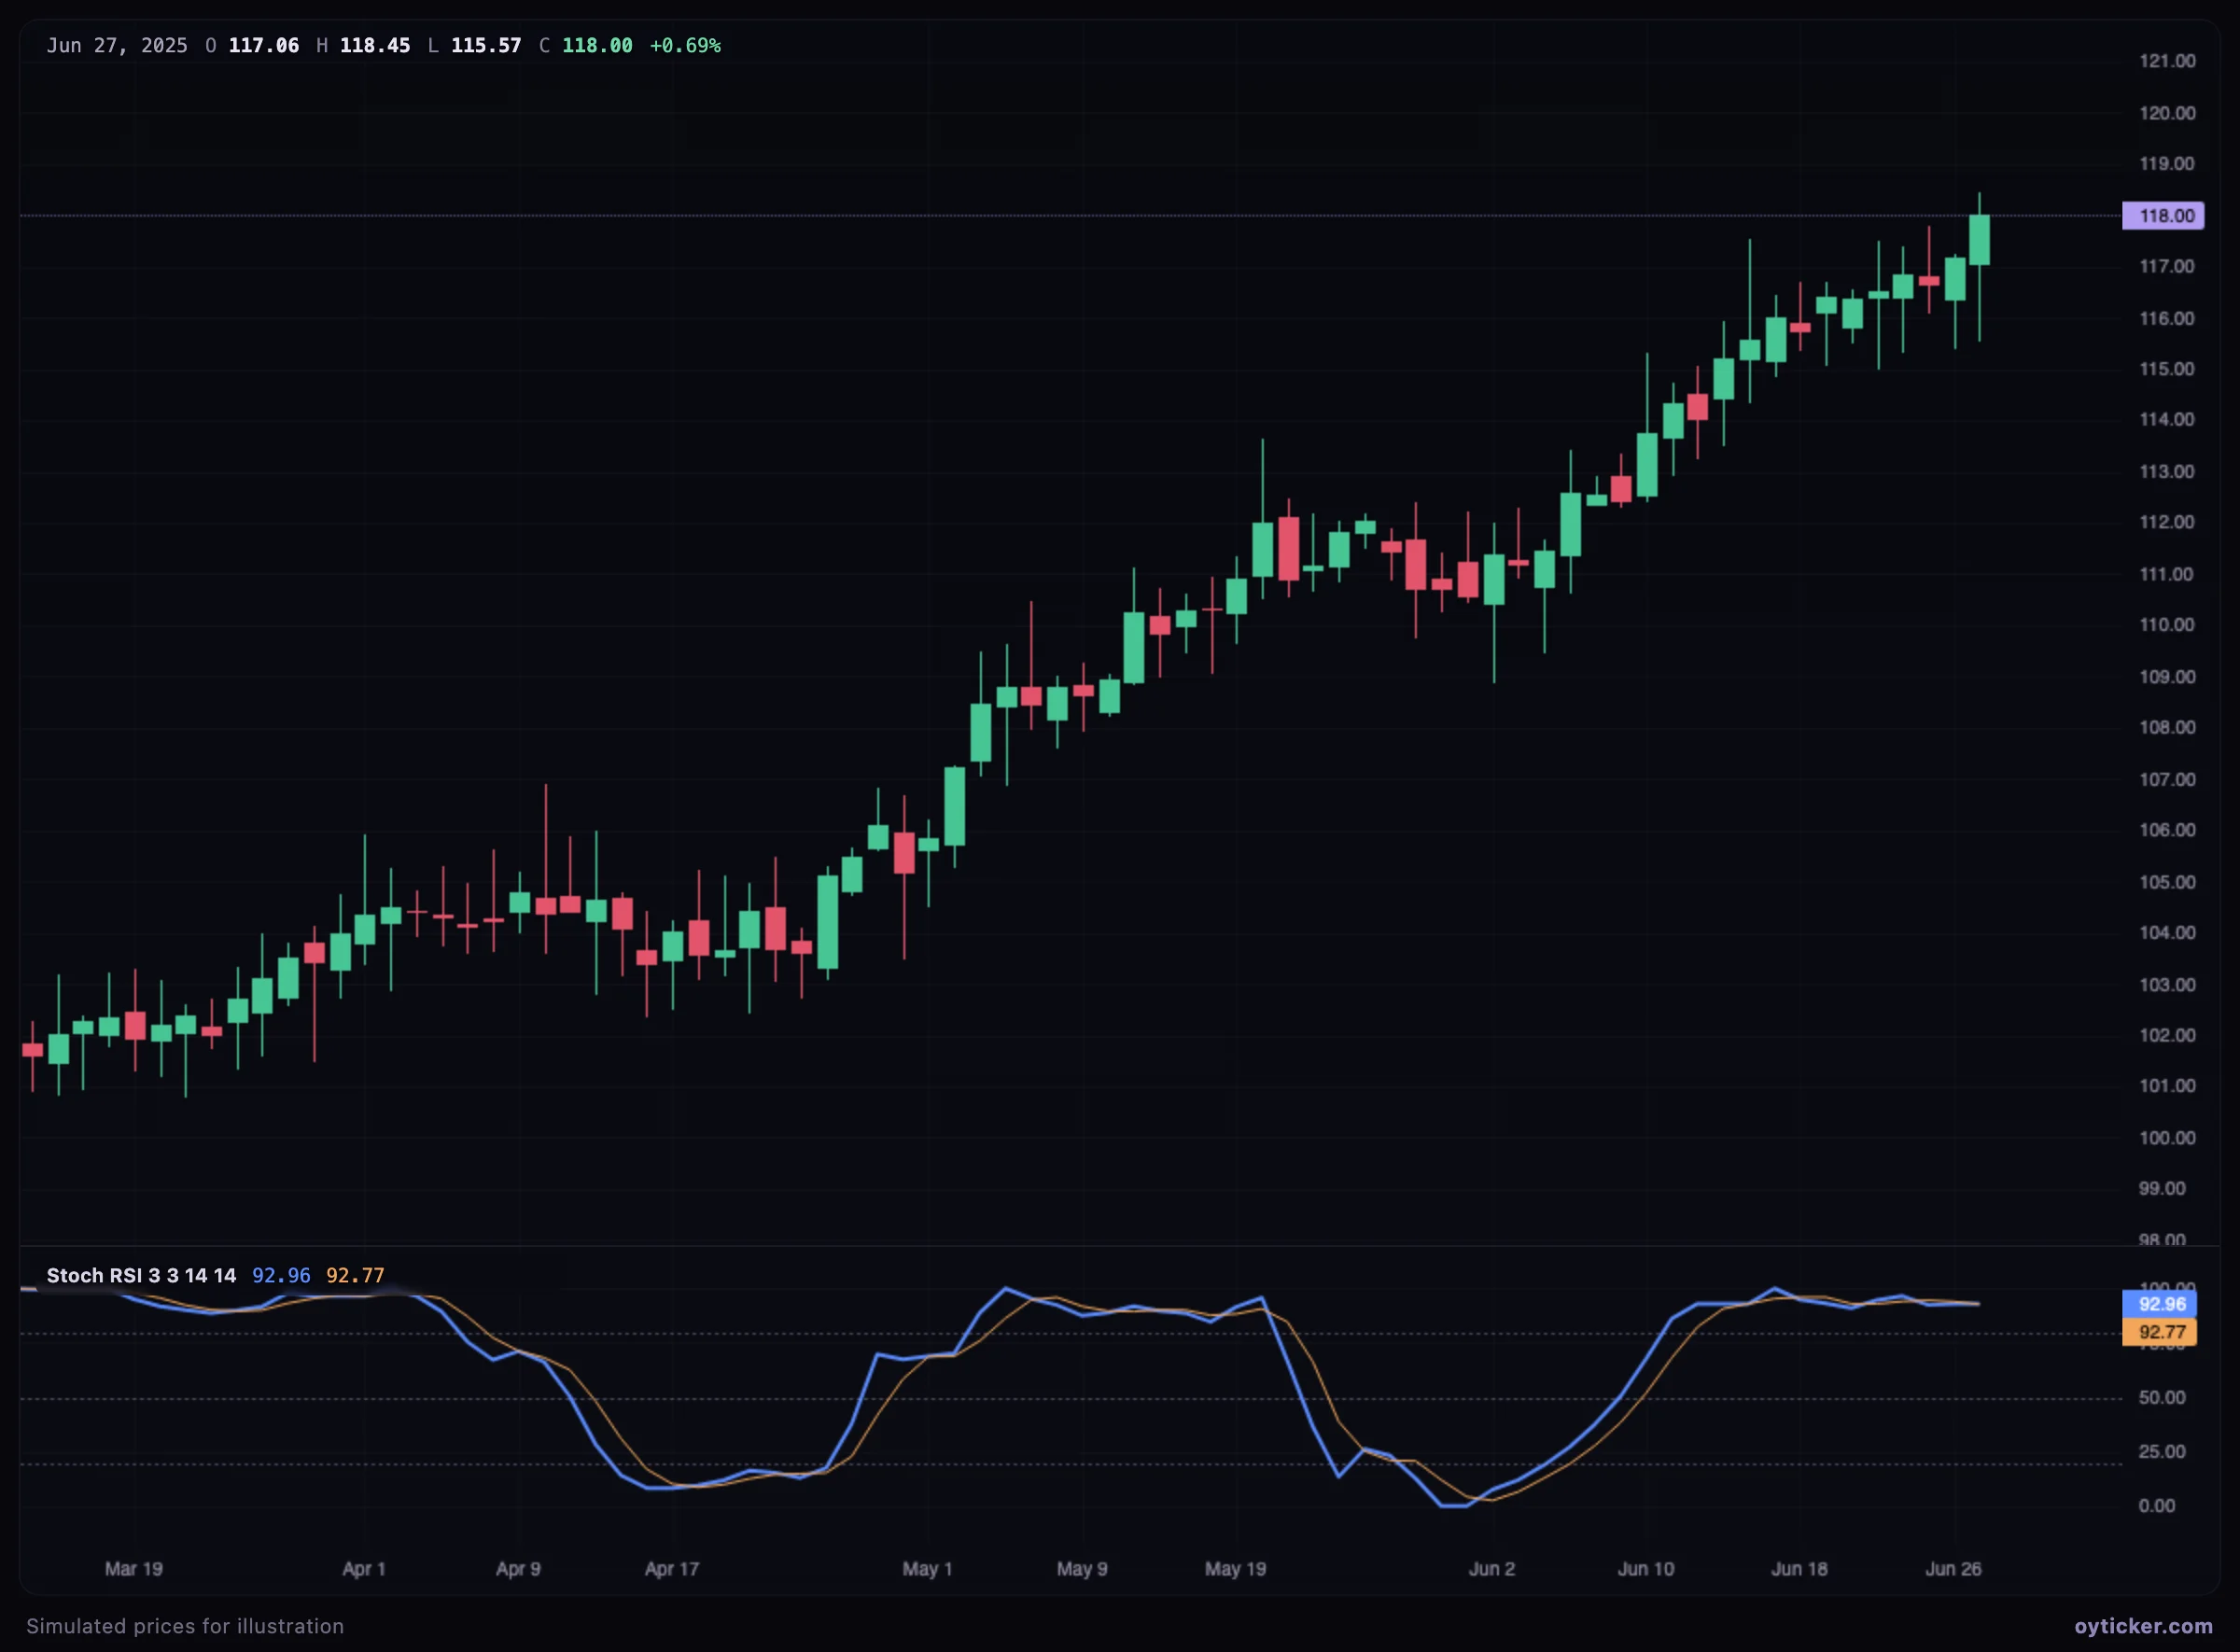
Case study: pinned in a trend
Limits
- An oscillator of an oscillator: very sensitive and noisy, with many false signals on its own.
- When the RSI is flat, its 14-bar range is tiny and the Stochastic RSI can swing from 0 to 100 on insignificant moves.
Charts in this guide use simulated prices generated for illustration; levels and outcomes shown are examples, not observations of a real market. Educational content only, not investment advice.