Indicators · Momentum

RSI (Relative Strength Index)

The RSI, introduced by J. Welles Wilder in 1978, compares the size of recent gains with recent losses on a scale from 0 to 100. Readings above 70 are traditionally called overbought and below 30 oversold; divergences and the RSI's range in trends are often more informative than the levels themselves.

What it's for
  • Measure the momentum of recent gains versus recent losses on a 0–100 scale.
  • Spot overbought and oversold conditions in ranges.
  • Detect divergences and the shift of the RSI's range in trends.
Pane
Separate, 0 to 100
Plan
Every plan
Settings
Length, source, overbought, oversold
Default
14, close, 70 / 30 (and 50)

Calculation

gain = max(close − close[1], 0),  loss = max(close[1] − close, 0)
avg gain = RMA(gain, 14),  avg loss = RMA(loss, 14)       Wilder's smoothing, α = 1/14
RSI = 100 − 100 / (1 + avg gain / avg loss)

Wilder's moving average (RMA) is an exponential average with α = 1/n, started from a simple average. RSI is 100 when there was no loss and 0 when there was no gain, as in TradingView's built-in RSI.

Overbought and oversold in a range
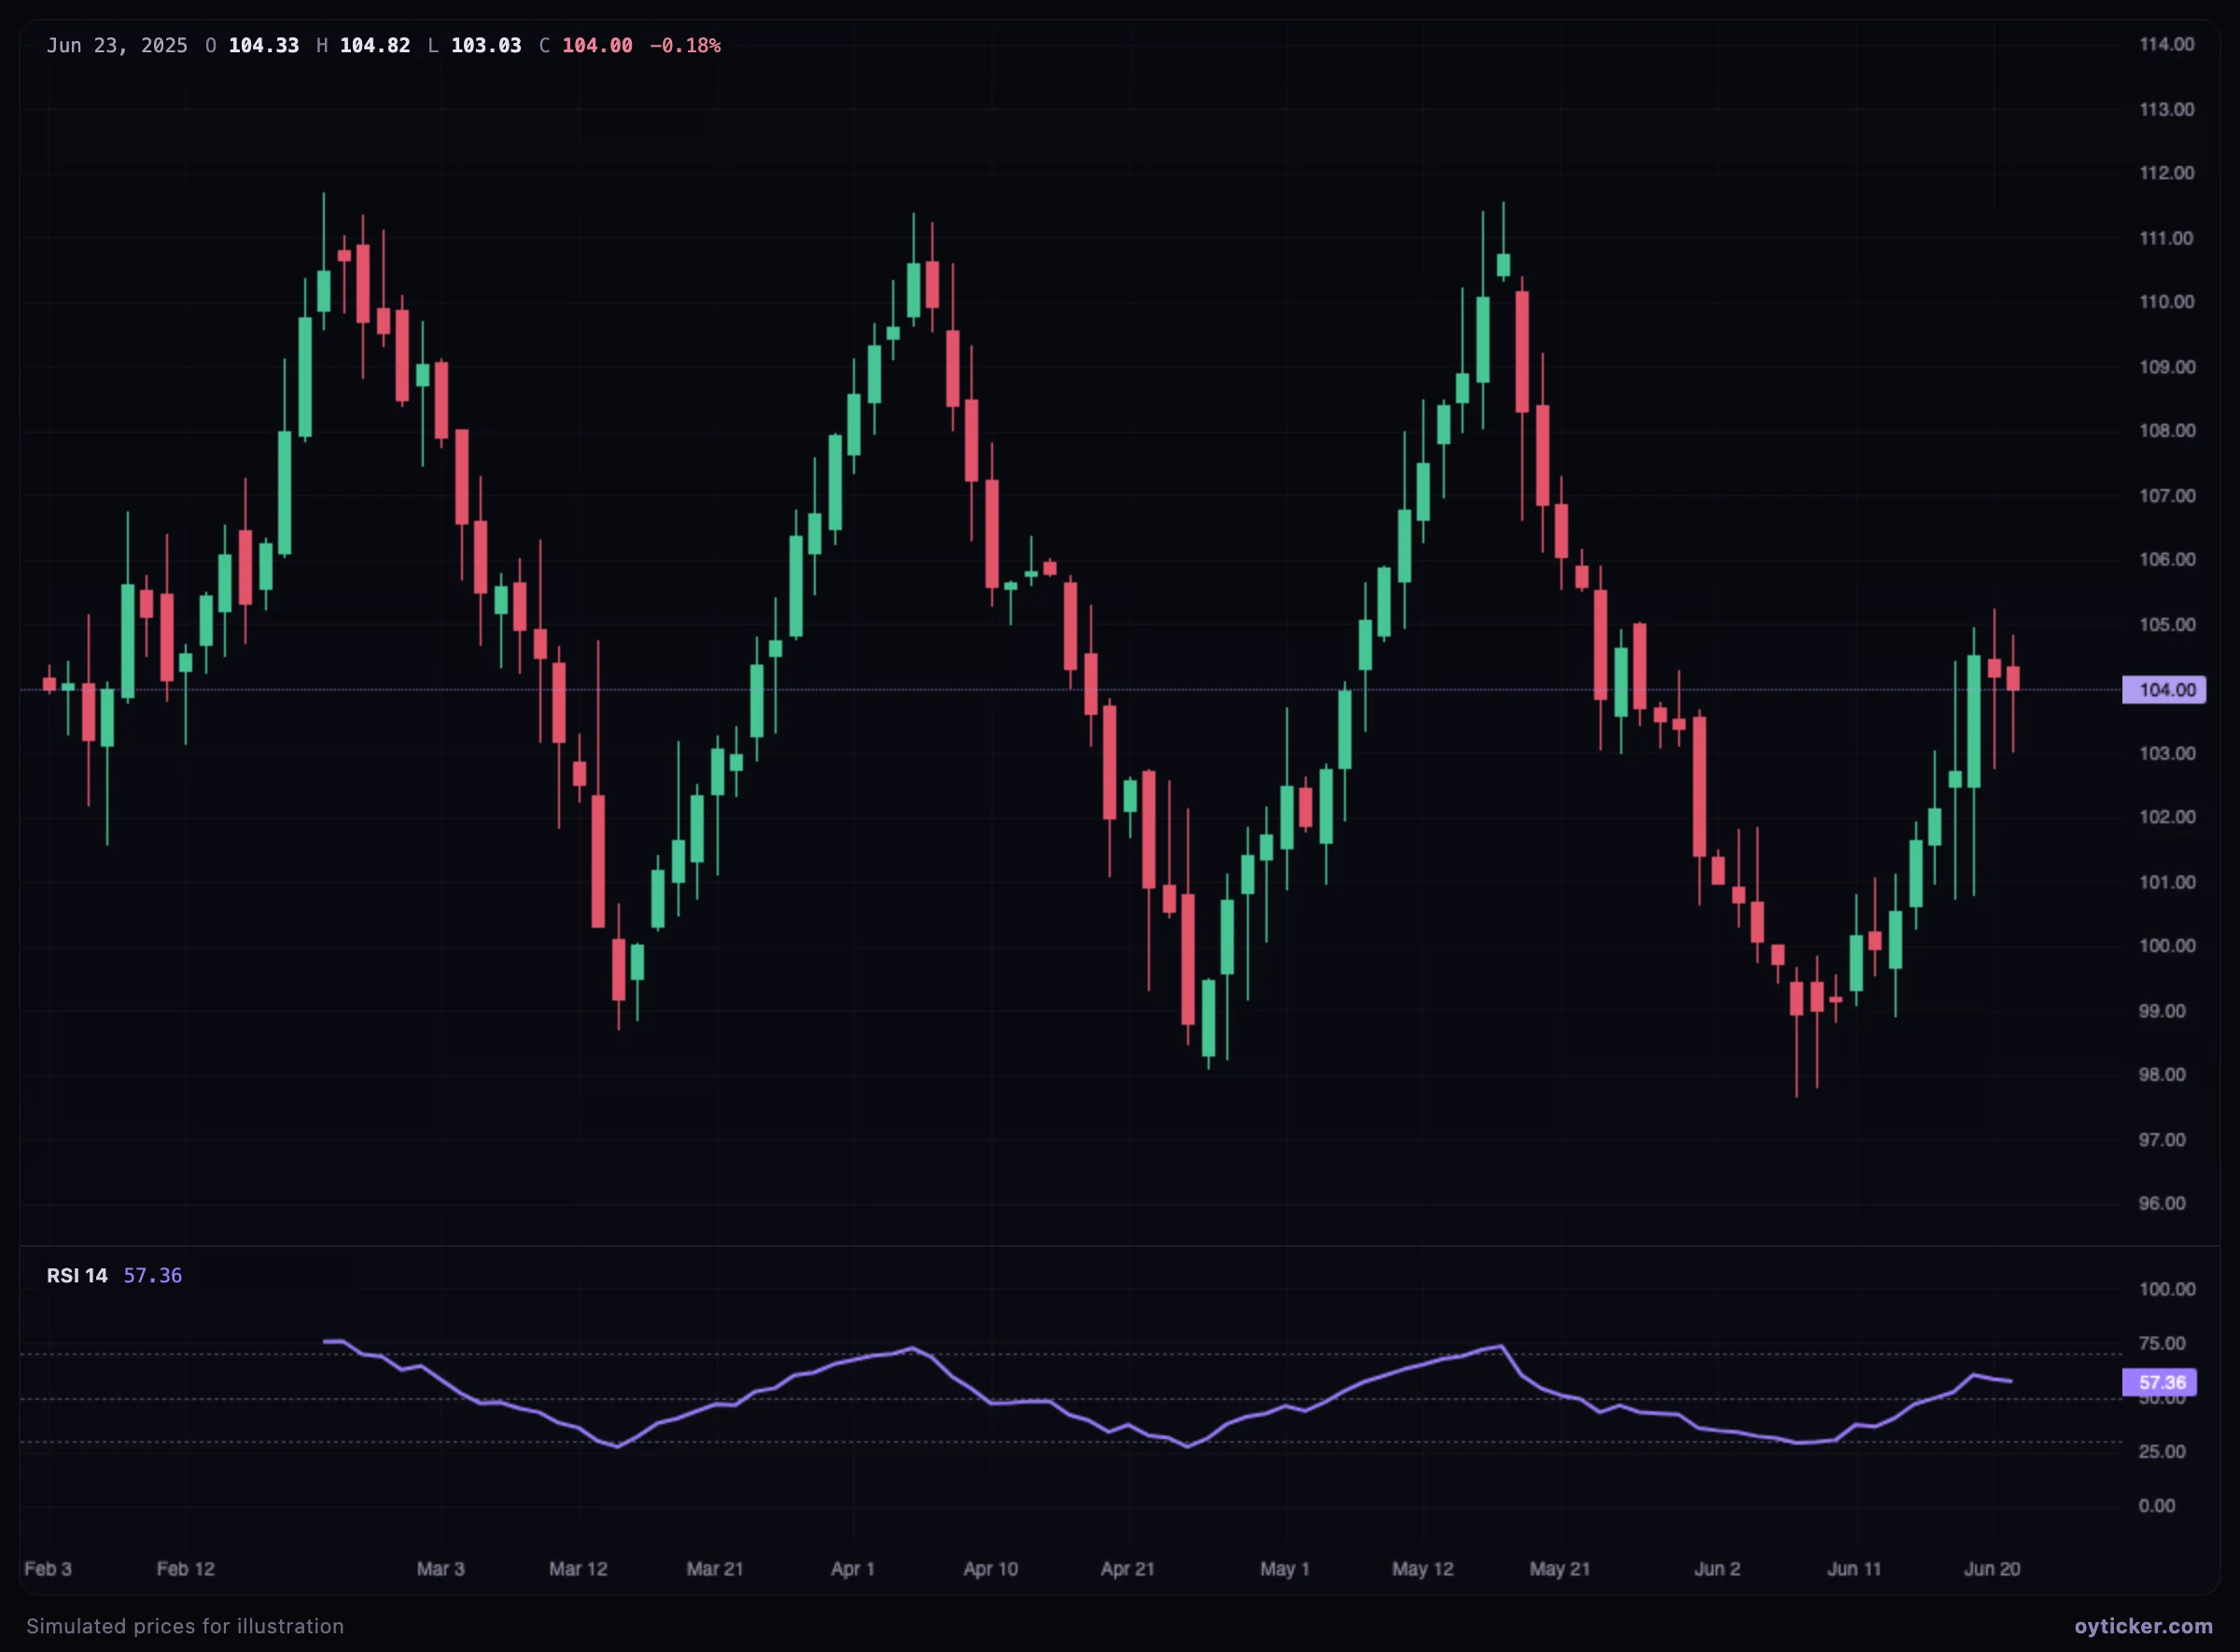
Range-bound market with the RSI above 70 at the highs and below 30 at the lows
In a range, the RSI rises above 70 near the highs and falls below 30 near the lows: here the levels work as intended, marking the extremes of the oscillation.

In a trend: the range shift

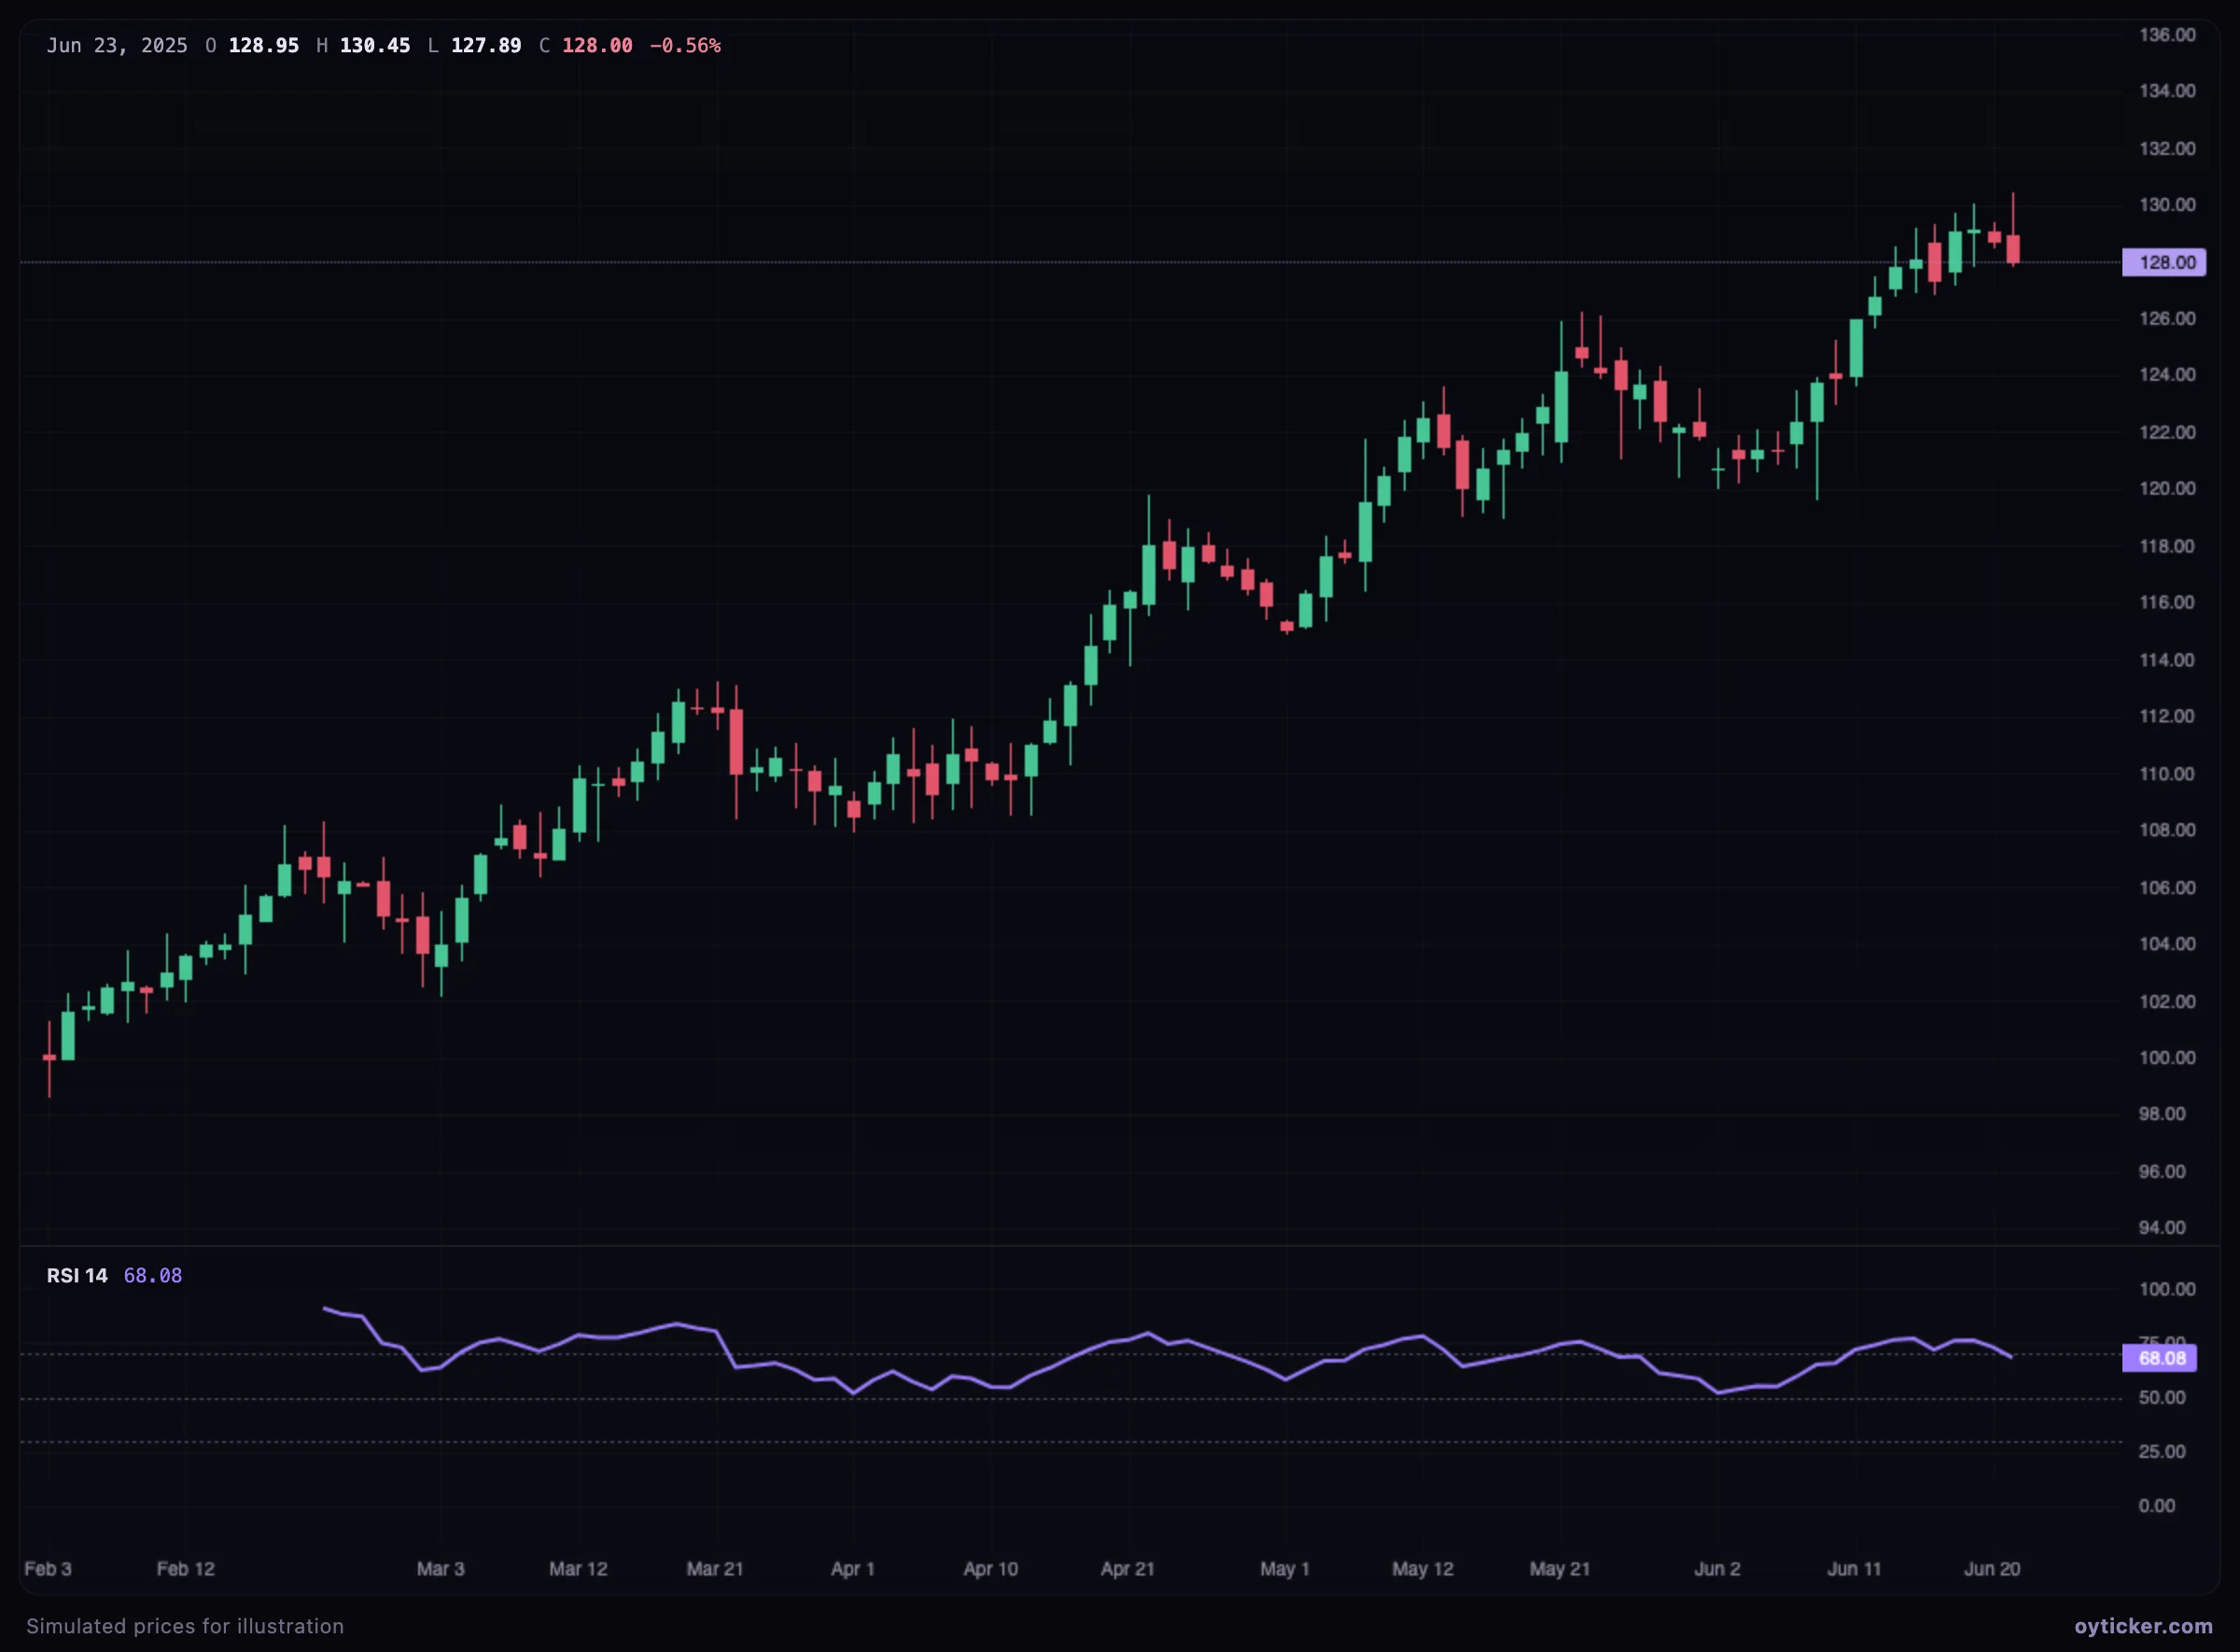
Steady uptrend where the RSI stays above 50 and is often above 70
In a steady uptrend the RSI never falls below 50 and spends many bars above 70. Selling every overbought reading would have meant selling the whole trend.

Analysts such as Andrew Cardwell and Constance Brown observed that the RSI shifts its range with the trend: roughly 40–80 in uptrends (pullbacks find support around 40–50) and 20–60 in downtrends. A failure to reach 70 in an uptrend, or a drop below 40, then says more than an overbought reading.

Case study: a bullish divergence
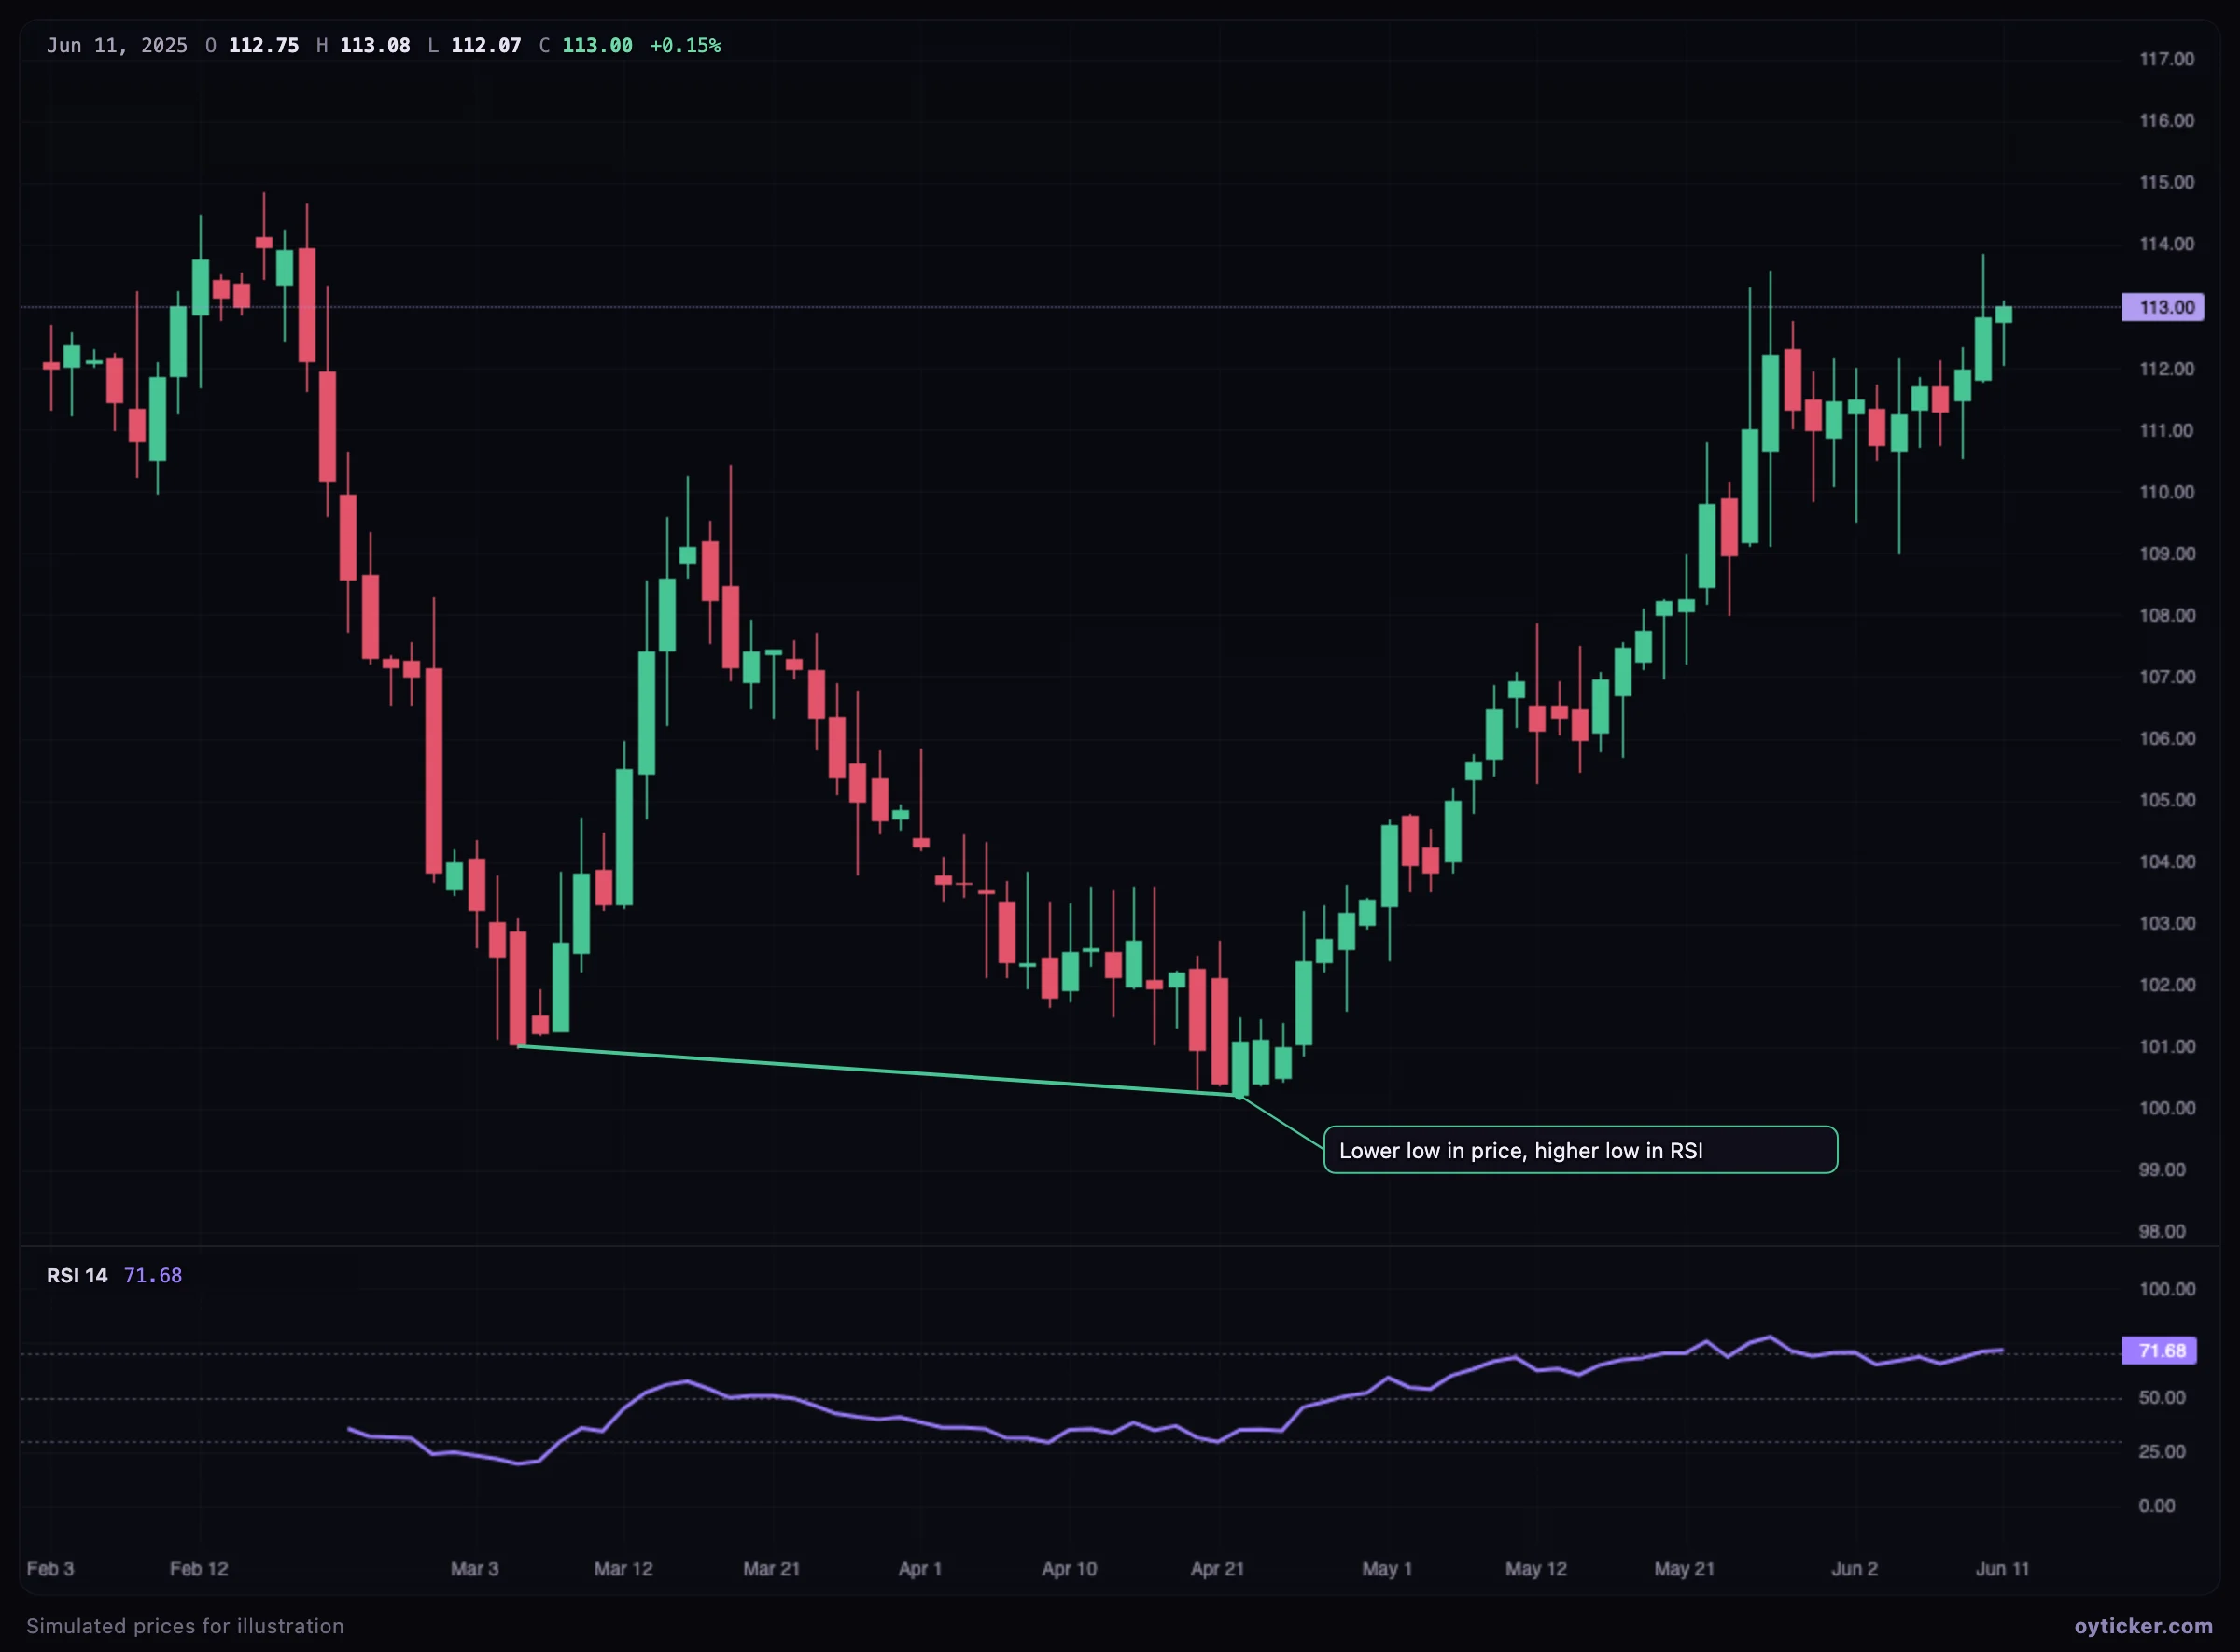
Price makes a lower low while the RSI makes a higher low, followed by a rally
The first low follows a fast drop (RSI near 20). The second low is lower in price but reached by a slower drift: the RSI makes a higher low, around 30. Selling pressure was weaker, and a rally follows.

A divergence shows a loss of momentum, not a reversal by itself: in strong trends divergences can repeat several times before price turns. Wait for price confirmation (a break of the last swing high for a bullish divergence).

Limits

  • Overbought means strong, not expensive: in trends the RSI can stay above 70 for long periods.
  • The RSI needs a warm-up: its first value appears after 14 bars and early values depend on where the data starts.

Charts in this guide use simulated prices generated for illustration; levels and outcomes shown are examples, not observations of a real market. Educational content only, not investment advice.

RSI: Wilder's formula, overbought and oversold, divergences and range shift | Oyticker