
Formulas
H, L, C and O are the previous period's high, low, close and open; R = H − L.
| Type | Pivot P | Resistances | Supports |
|---|---|---|---|
| Traditional | (H + L + C) / 3 | R1 = 2P − L · R2 = P + R · R3 = 2P + (H − 2L) · R4 = 3P + (H − 3L) · R5 = 4P + (H − 4L) | S1 = 2P − H · S2 = P − R · S3 = 2P − (2H − L) · S4 = 3P − (3H − L) · S5 = 4P − (4H − L) |
| Fibonacci | (H + L + C) / 3 | P + 0.382R · P + 0.618R · P + R | P − 0.382R · P − 0.618R · P − R |
| Woodie | (H + L + 2C) / 4 | R1 = 2P − L · R2 = P + R · R3 = H + 2(P − L) · R4 = R3 + R | S1 = 2P − H · S2 = P − R · S3 = L − 2(H − P) · S4 = S3 − R |
| Classic | (H + L + C) / 3 | 2P − L · P + R · P + 2R · P + 3R | 2P − H · P − R · P − 2R · P − 3R |
| Camarilla | (H + L + C) / 3 | R1–R4 = C + 1.1R/12, /6, /4, /2 · R5 = (H / L) × C | S1–S4 = C − 1.1R/12, /6, /4, /2 · S5 = C − (R5 − C) |
| DeMark | X / 4 | R1 = X/2 − L | S1 = X/2 − H |
For DeMark, X = H + 2L + C if the previous close was below its open, 2H + L + C if above, and H + L + 2C if equal.
Daily pivots on the intraday chart
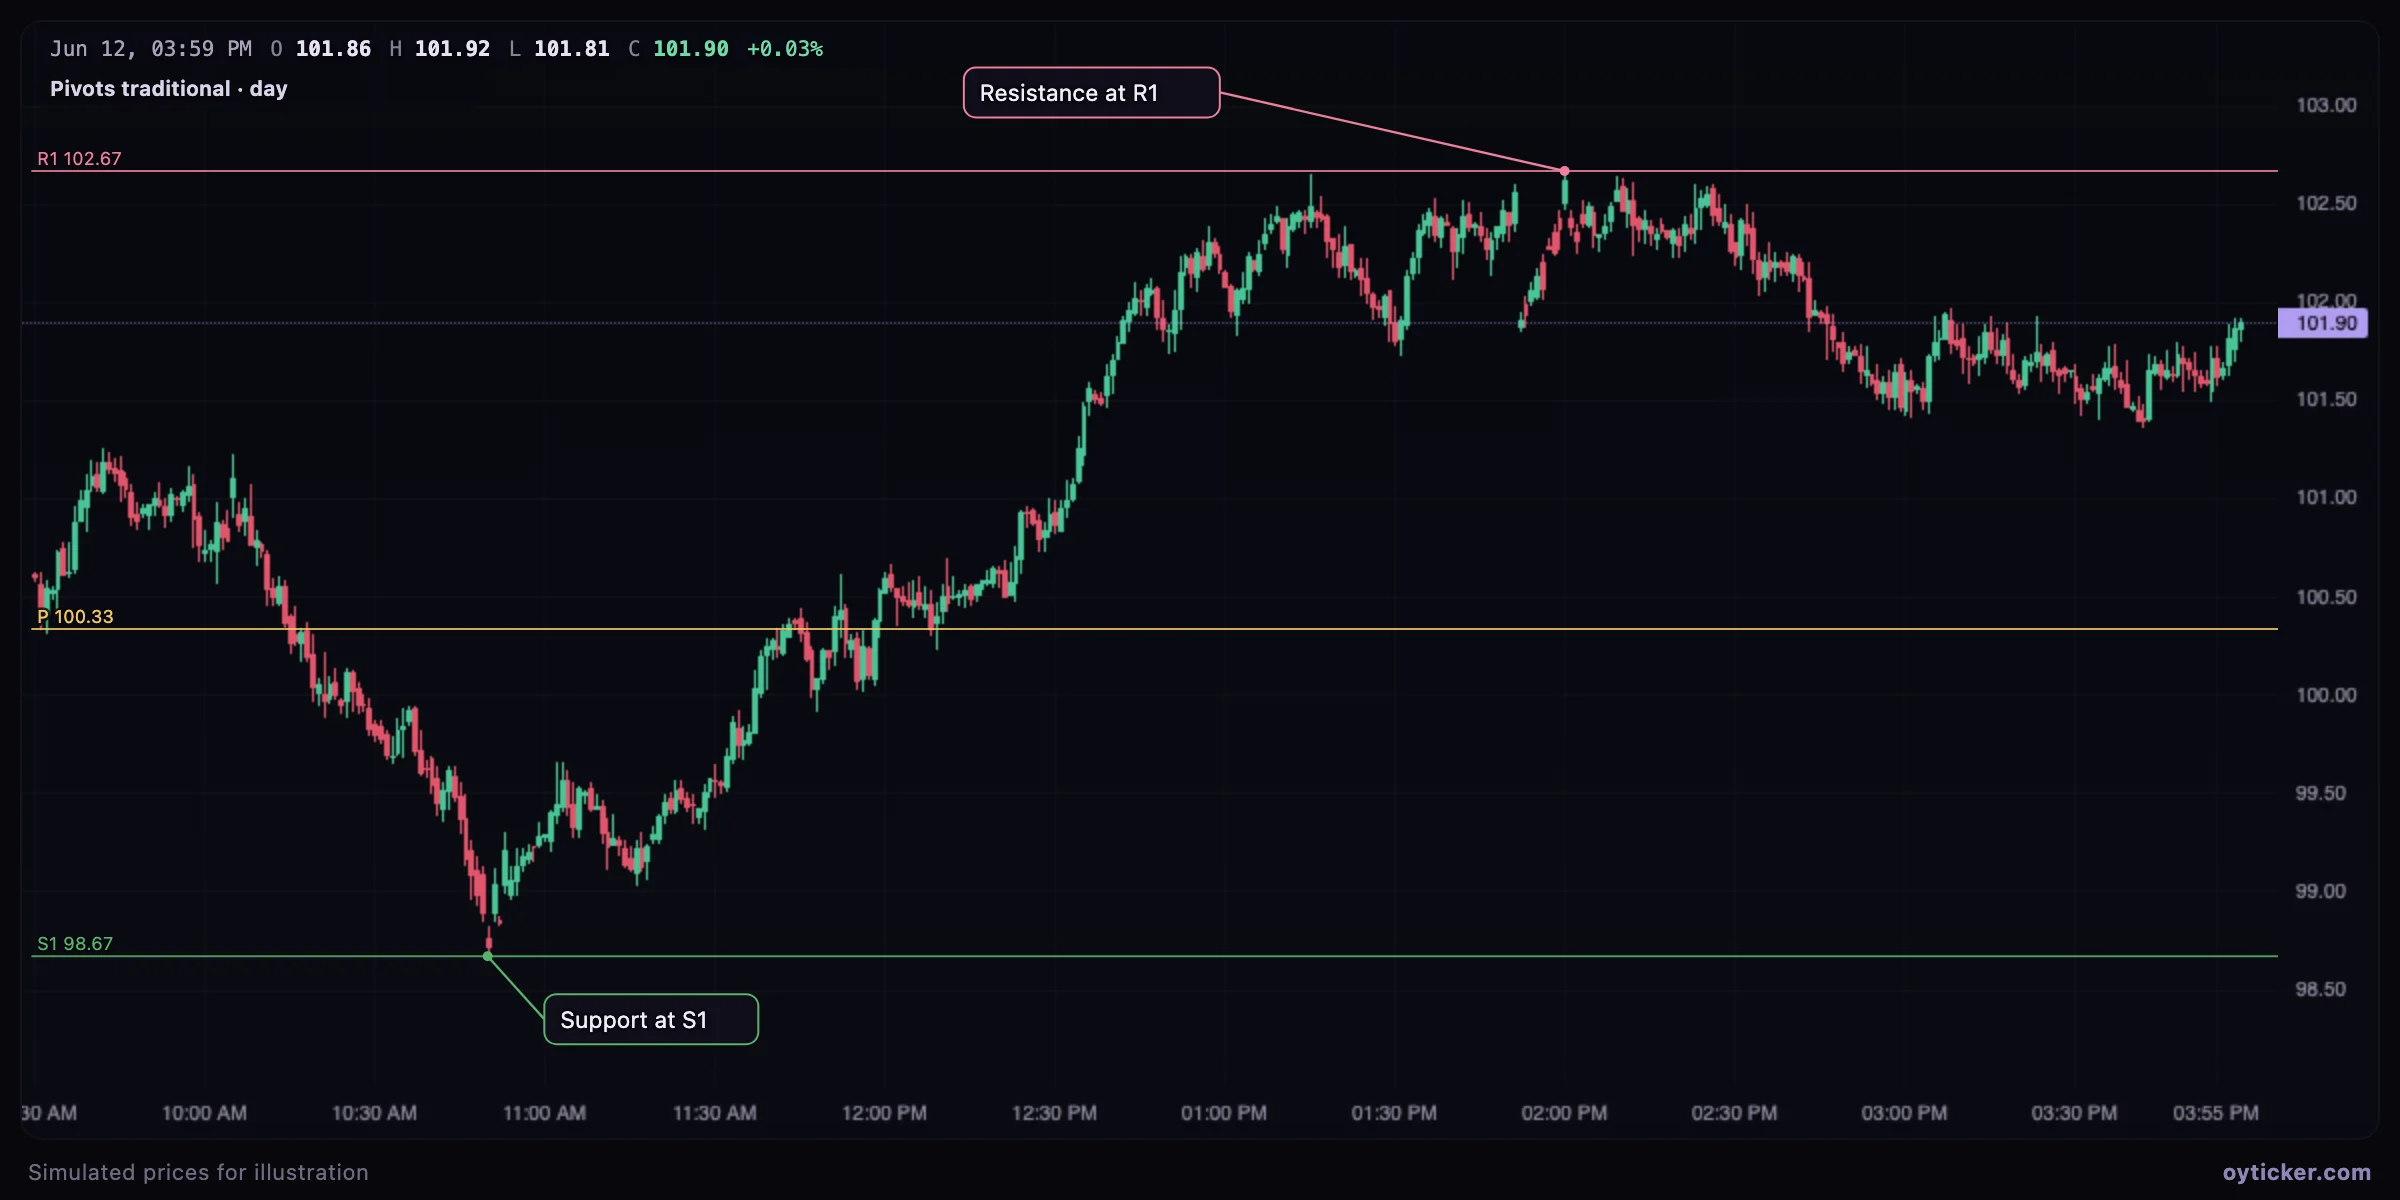
- Price above P is read as a bullish session bias, below P as bearish.
- R1/S1 are the most frequently reached levels; R2/S2 and beyond are reached on trending days.
- On the 1D view Oyticker computes the daily levels from the previous session's daily candle.
Weekly, monthly and yearly pivots
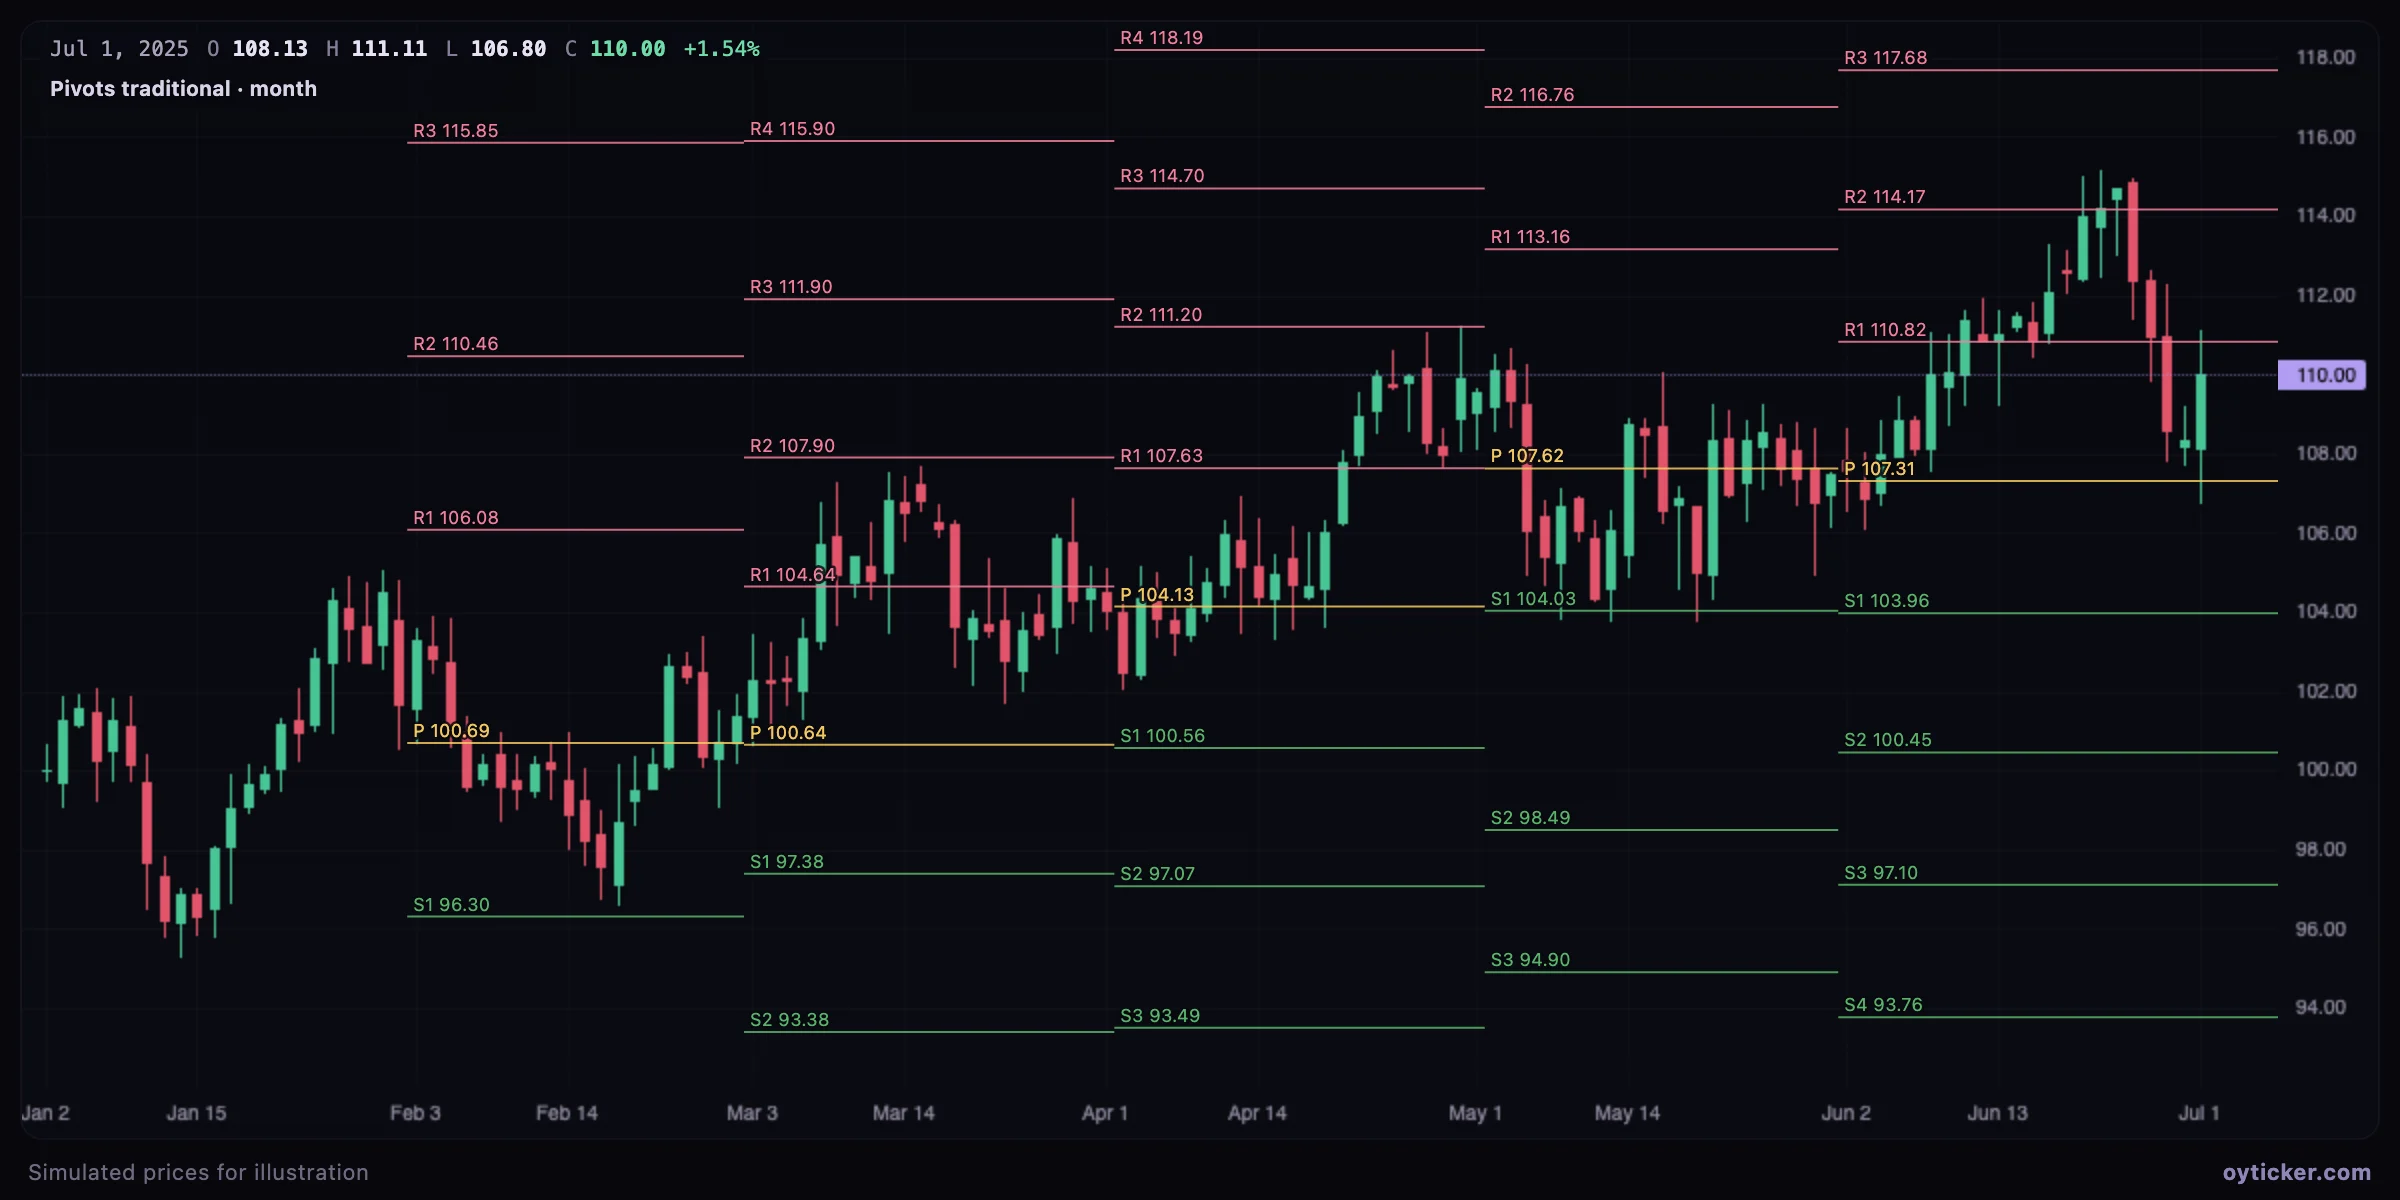
Longer periods give fewer, more significant levels: monthly and yearly pivots are watched by swing traders and investors.
Charts in this guide use simulated prices generated for illustration; levels and outcomes shown are examples, not observations of a real market. Educational content only, not investment advice.