
Calculation
tp    = (high + low + close) / 3
VWAP  = Σ(tp × volume) / Σ(volume)          since the start of the period
σ     = √( Σ(tp² × volume) / Σ(volume) − VWAP² )
Sums restart at each new period of the anchor (session, week, month, quarter, year) in the market's time zone. The bands are VWAP ± 1σ and ± 2σ.
Reading it intraday
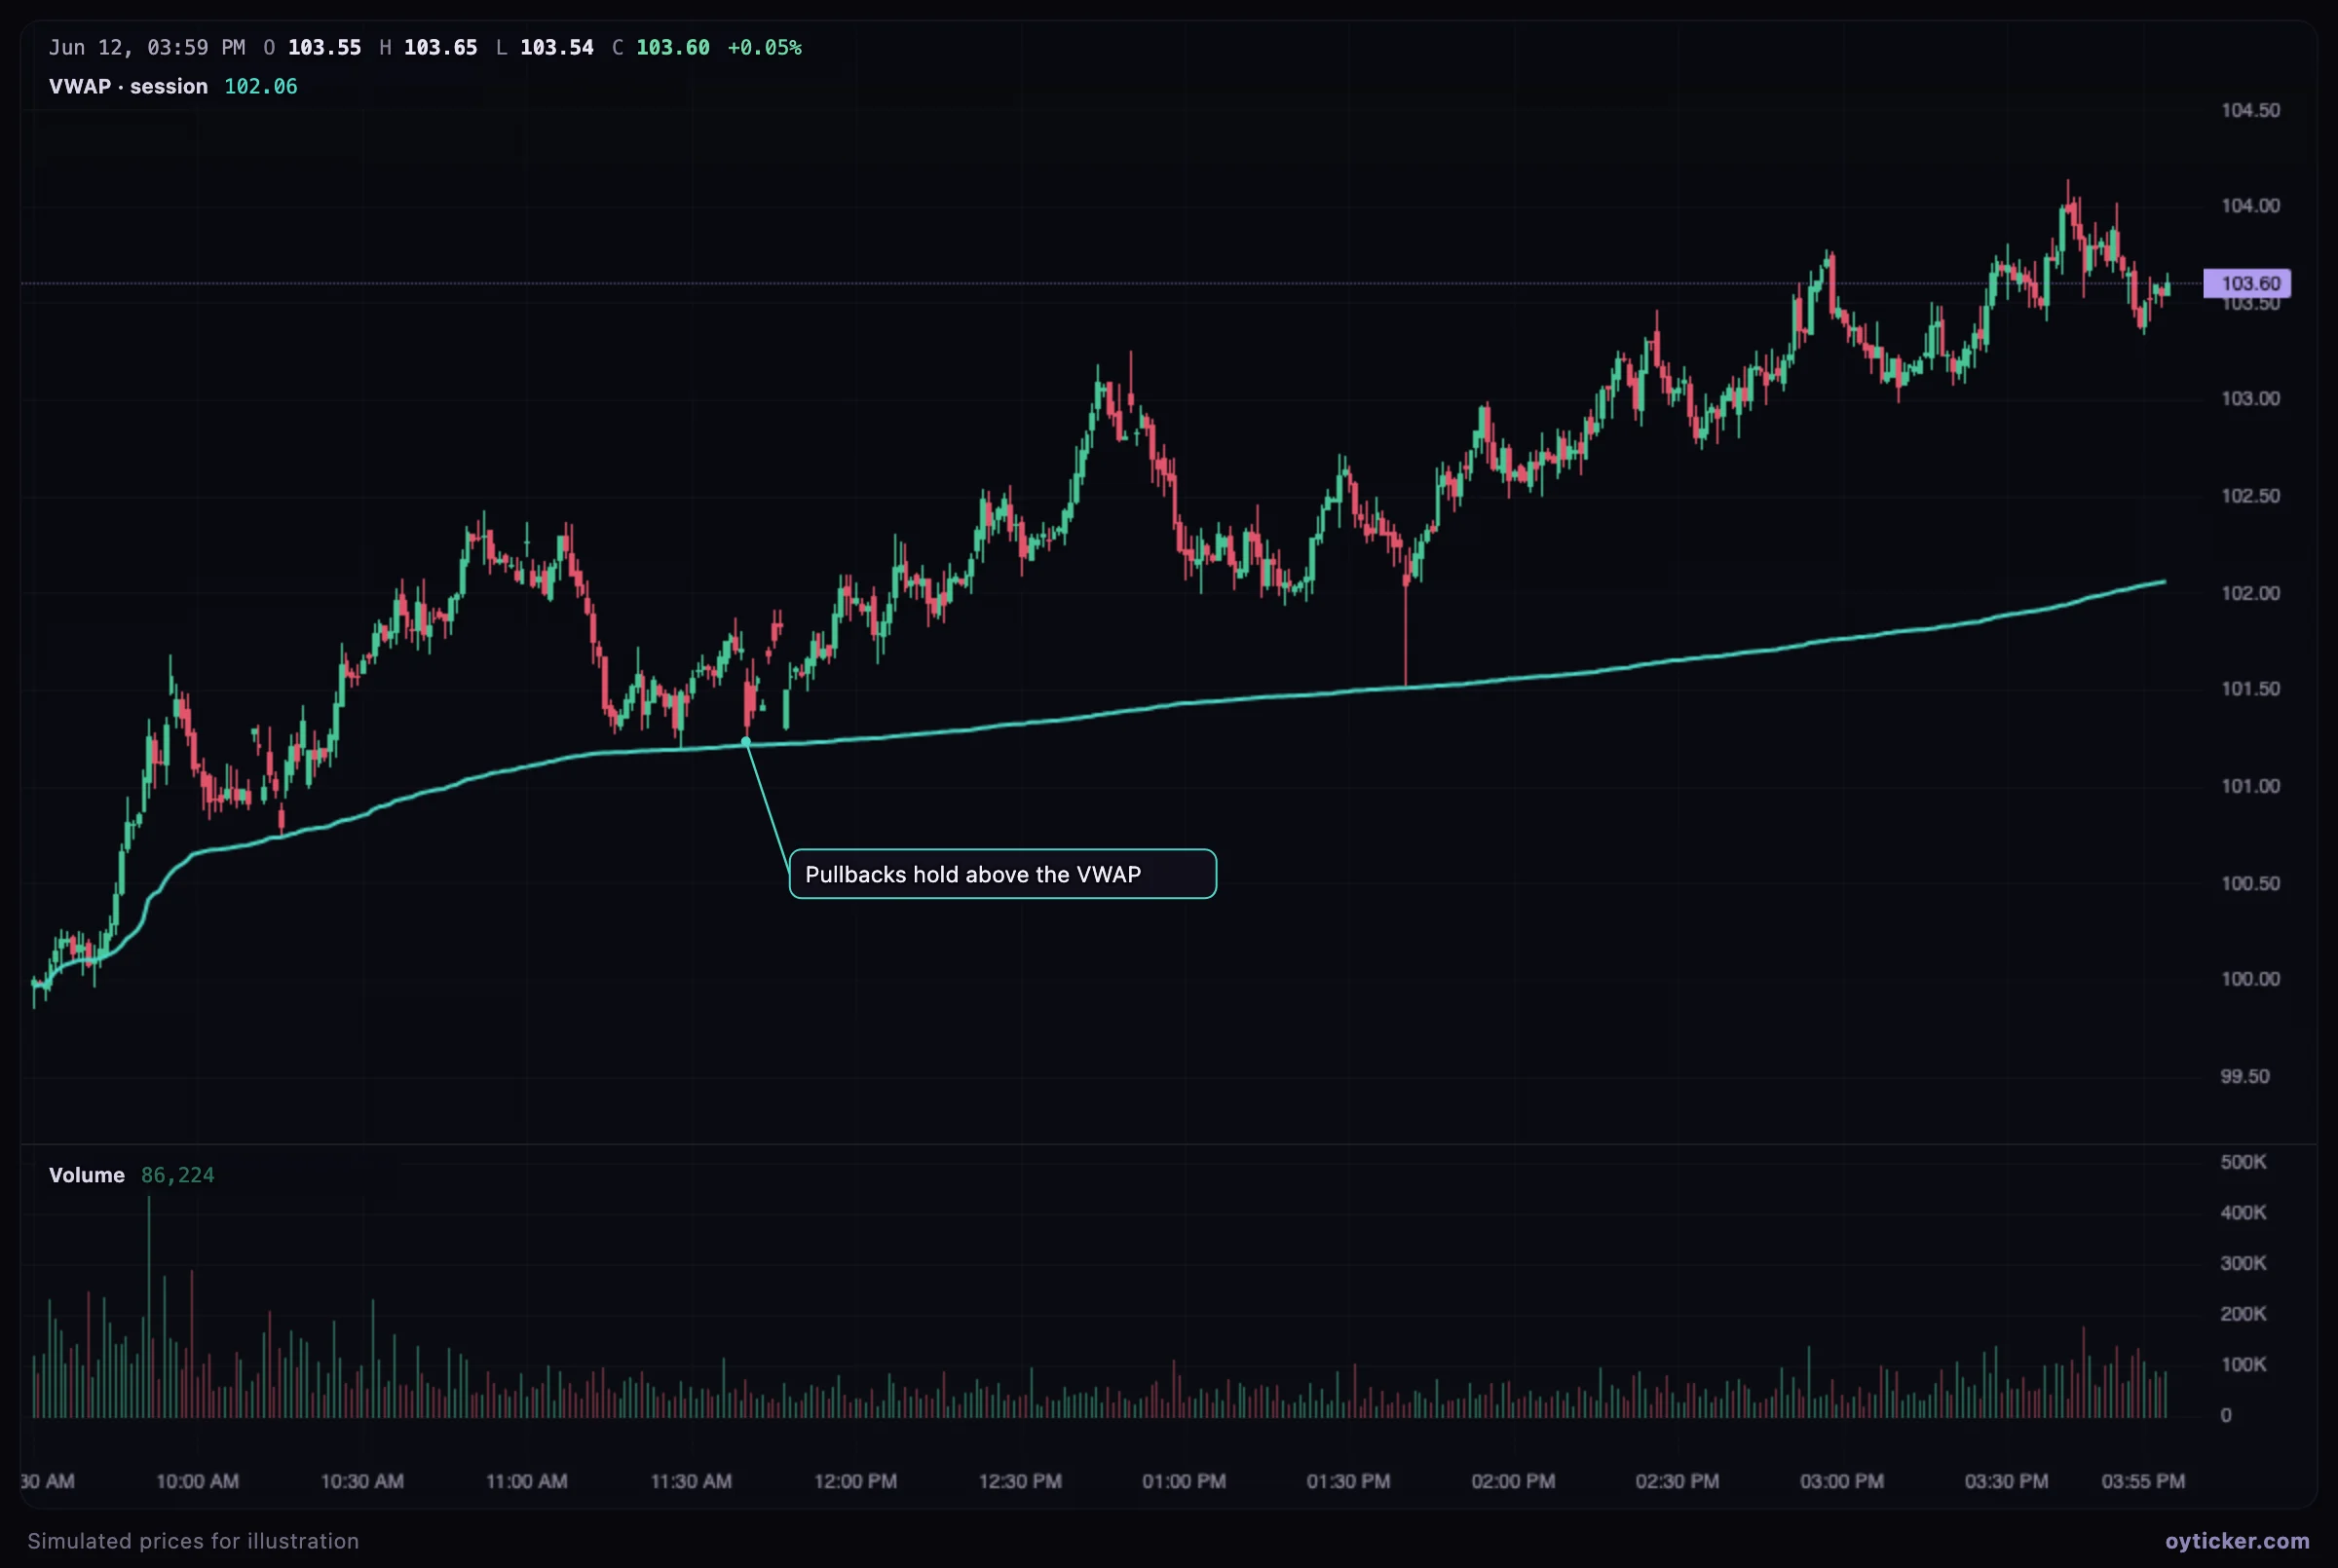
- Above a rising VWAP, buyers are in control; pullbacks to it are the classic intraday entries for longs. Below a falling VWAP, the reverse.
- Reclaiming the VWAP after trading below it shows a change of control within the session.
- Institutional benchmark: large orders are often worked to beat the VWAP, which creates real buying below it and selling above it on balanced days.
Case study: a balanced day and the σ bands
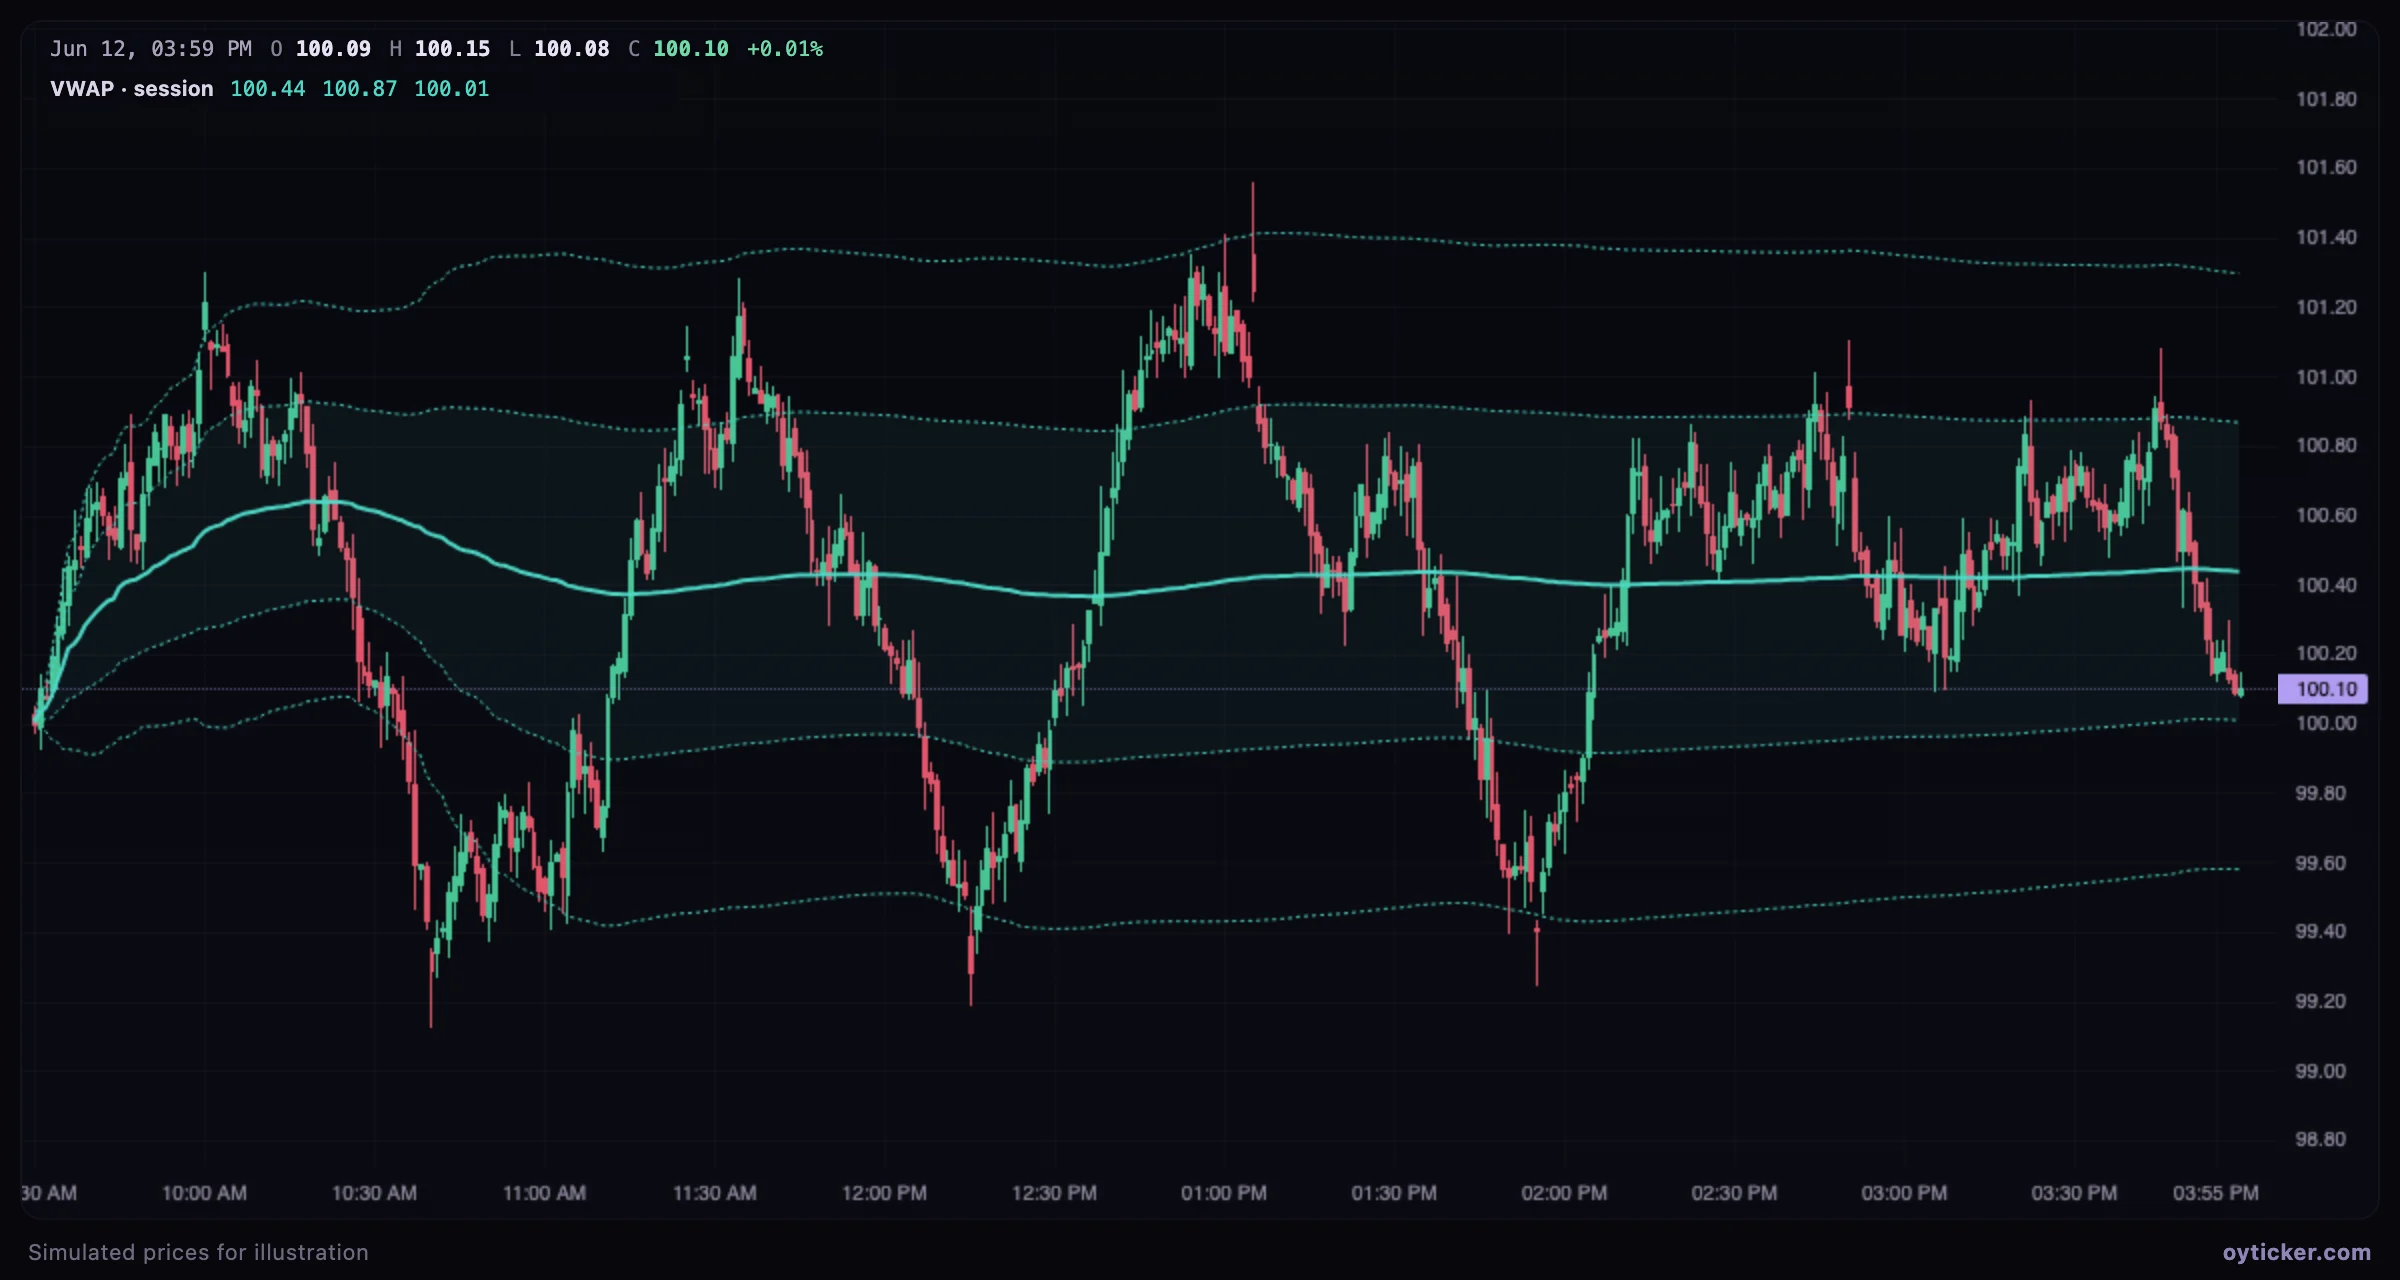
The same indicator supports opposite tactics depending on the day: trend days respect the VWAP as support or resistance, balanced days revert to it. The first hour's behavior and the volume usually tell which kind of day is unfolding.
Limits
- The VWAP is only as good as the volume data. On the 1D view of US stocks, the latest minutes may come from a real-time feed that covers one venue; Oyticker flags it under the chart when volume-based indicators are shown.
- Late in the session the VWAP barely moves: thousands of minutes of volume weigh against each new one.
- To start the average at a chosen event instead of a calendar period, use the anchored VWAP.
Charts in this guide use simulated prices generated for illustration; levels and outcomes shown are examples, not observations of a real market. Educational content only, not investment advice.