
Construction
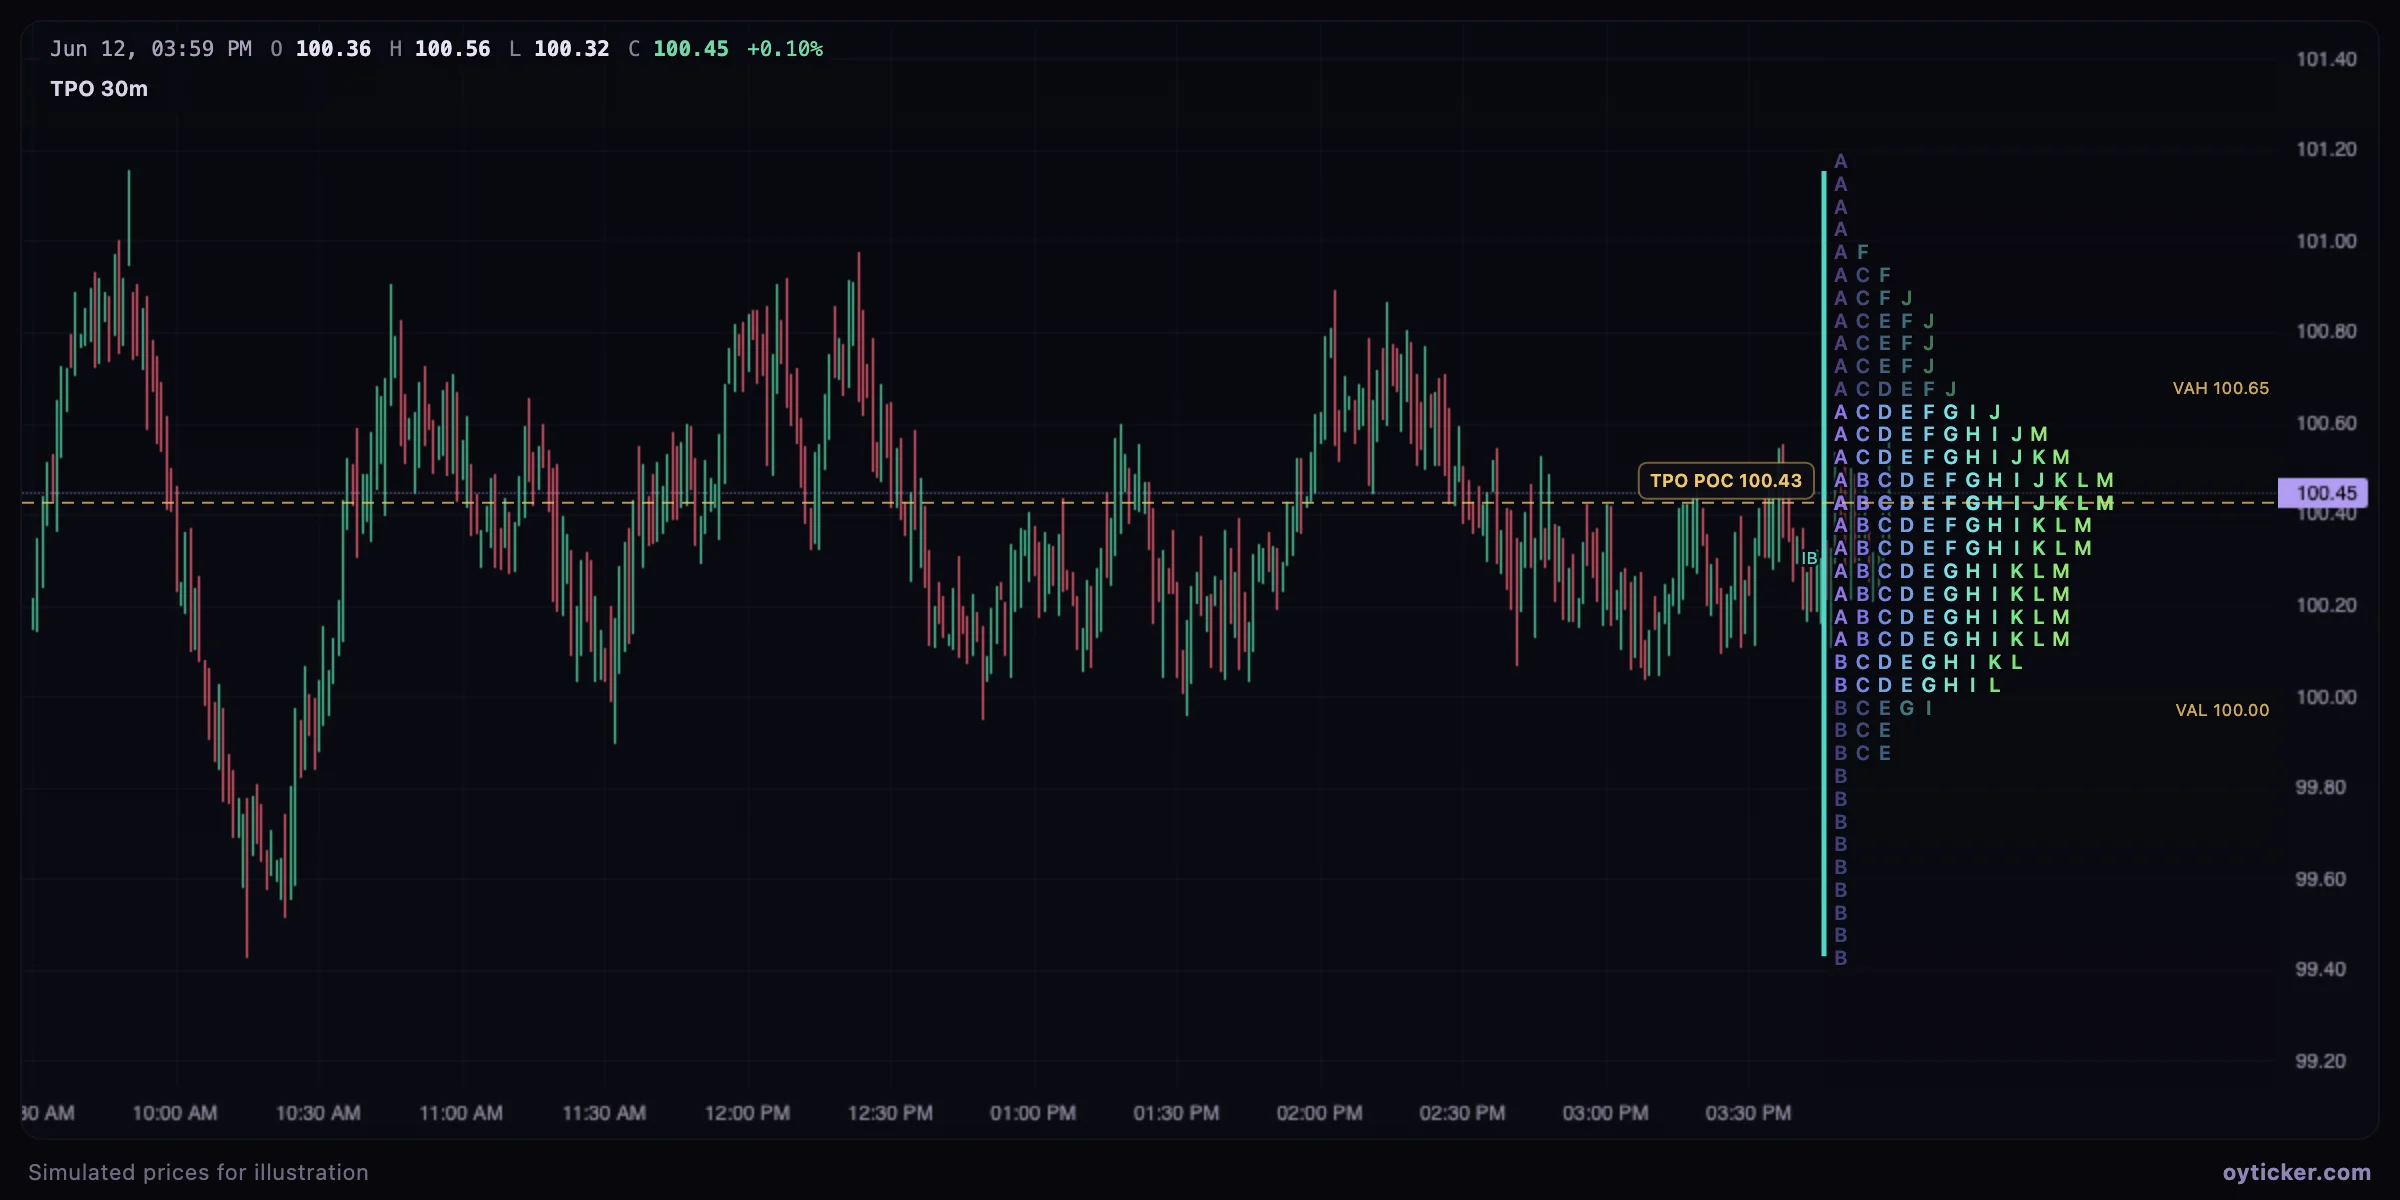
- The session's range is divided into about 40 price rows with a round step (1, 2, 2.5 or 5 times a power of ten).
- Period A is the first 30 minutes, B the next, and so on; each period writes its letter in every row between its high and low.
- POC: the row with the most letters (the longest); among equal rows, the one closest to the middle of the profile.
- Value area: 70% of all letters, built from the POC by pairs of rows, as in the CBOT method.
- Initial balance (IB): the range of the first two periods (the first hour), shown by the cyan bar.
- Single prints: rows inside the profile touched by a single period, the trace of a fast move.
How to read it
- A wide initial balance that holds all day describes a balanced, rotational session; a narrow one that is extended in one direction describes a trend day.
- The value area of a session is the reference for the next one: opening inside it suggests balance, opening outside and being accepted there suggests a new value.
- Single prints and poor highs or lows (several letters at the extreme) are often revisited.
Limits
The TPO needs intraday bars: it is available on the 1D view of 1-minute candles. Letters are assigned by clock periods aligned on the half hour.
Charts in this guide use simulated prices generated for illustration; levels and outcomes shown are examples, not observations of a real market. Educational content only, not investment advice.