
Support and resistance
Support is a level where declines have stopped because buyers absorbed the selling; resistance is a level where advances have stopped because sellers supplied enough shares or contracts. They exist because market participants remember prices: buyers who missed the last low place orders there, sellers who bought the last high want to get out at breakeven.
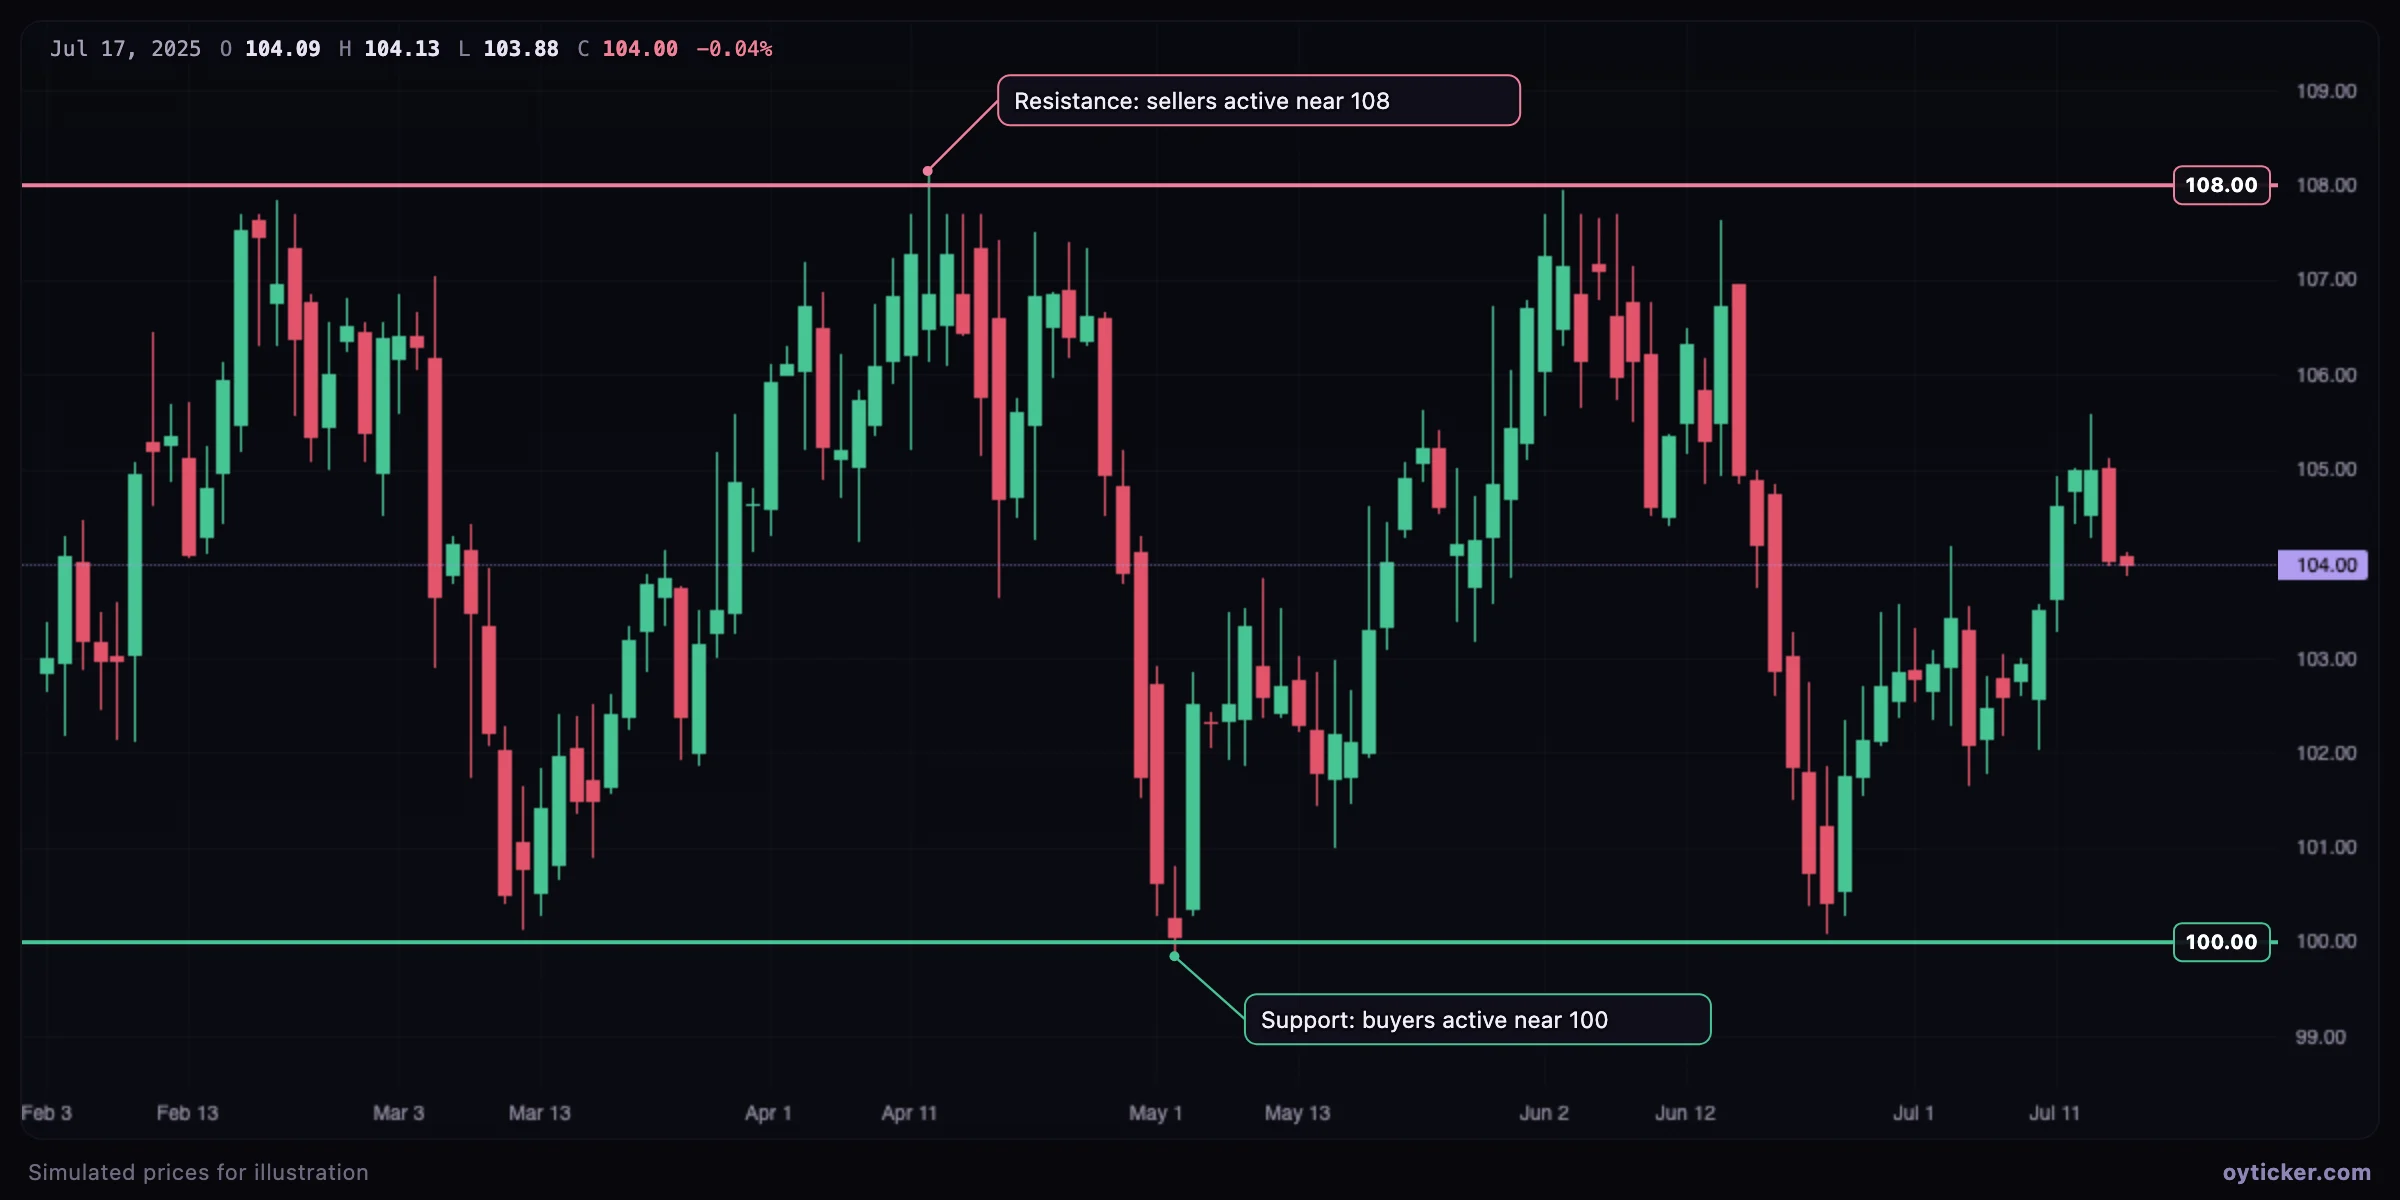
How to draw it
- Choose Lines → Horizontal line.
- Click once at the level. With the magnet on, the line snaps to the open, high, low or close of the candle under the pointer, which is how you place a level exactly on a swing high or low.
- The price is shown in a label on the right edge. Drag the line vertically to adjust it.
Good candidates are levels with several reactions, prior swing highs and lows of a higher timeframe, the previous day's high, low and close on intraday charts, and round numbers (100, 150, 1,000), where many orders are naturally placed.
Case study: resistance becomes support
When a resistance level finally breaks, the sellers who defended it are either filled or gone, and the buyers who missed the breakout wait for a pullback. The level often turns into support: this is called polarity or role reversal.
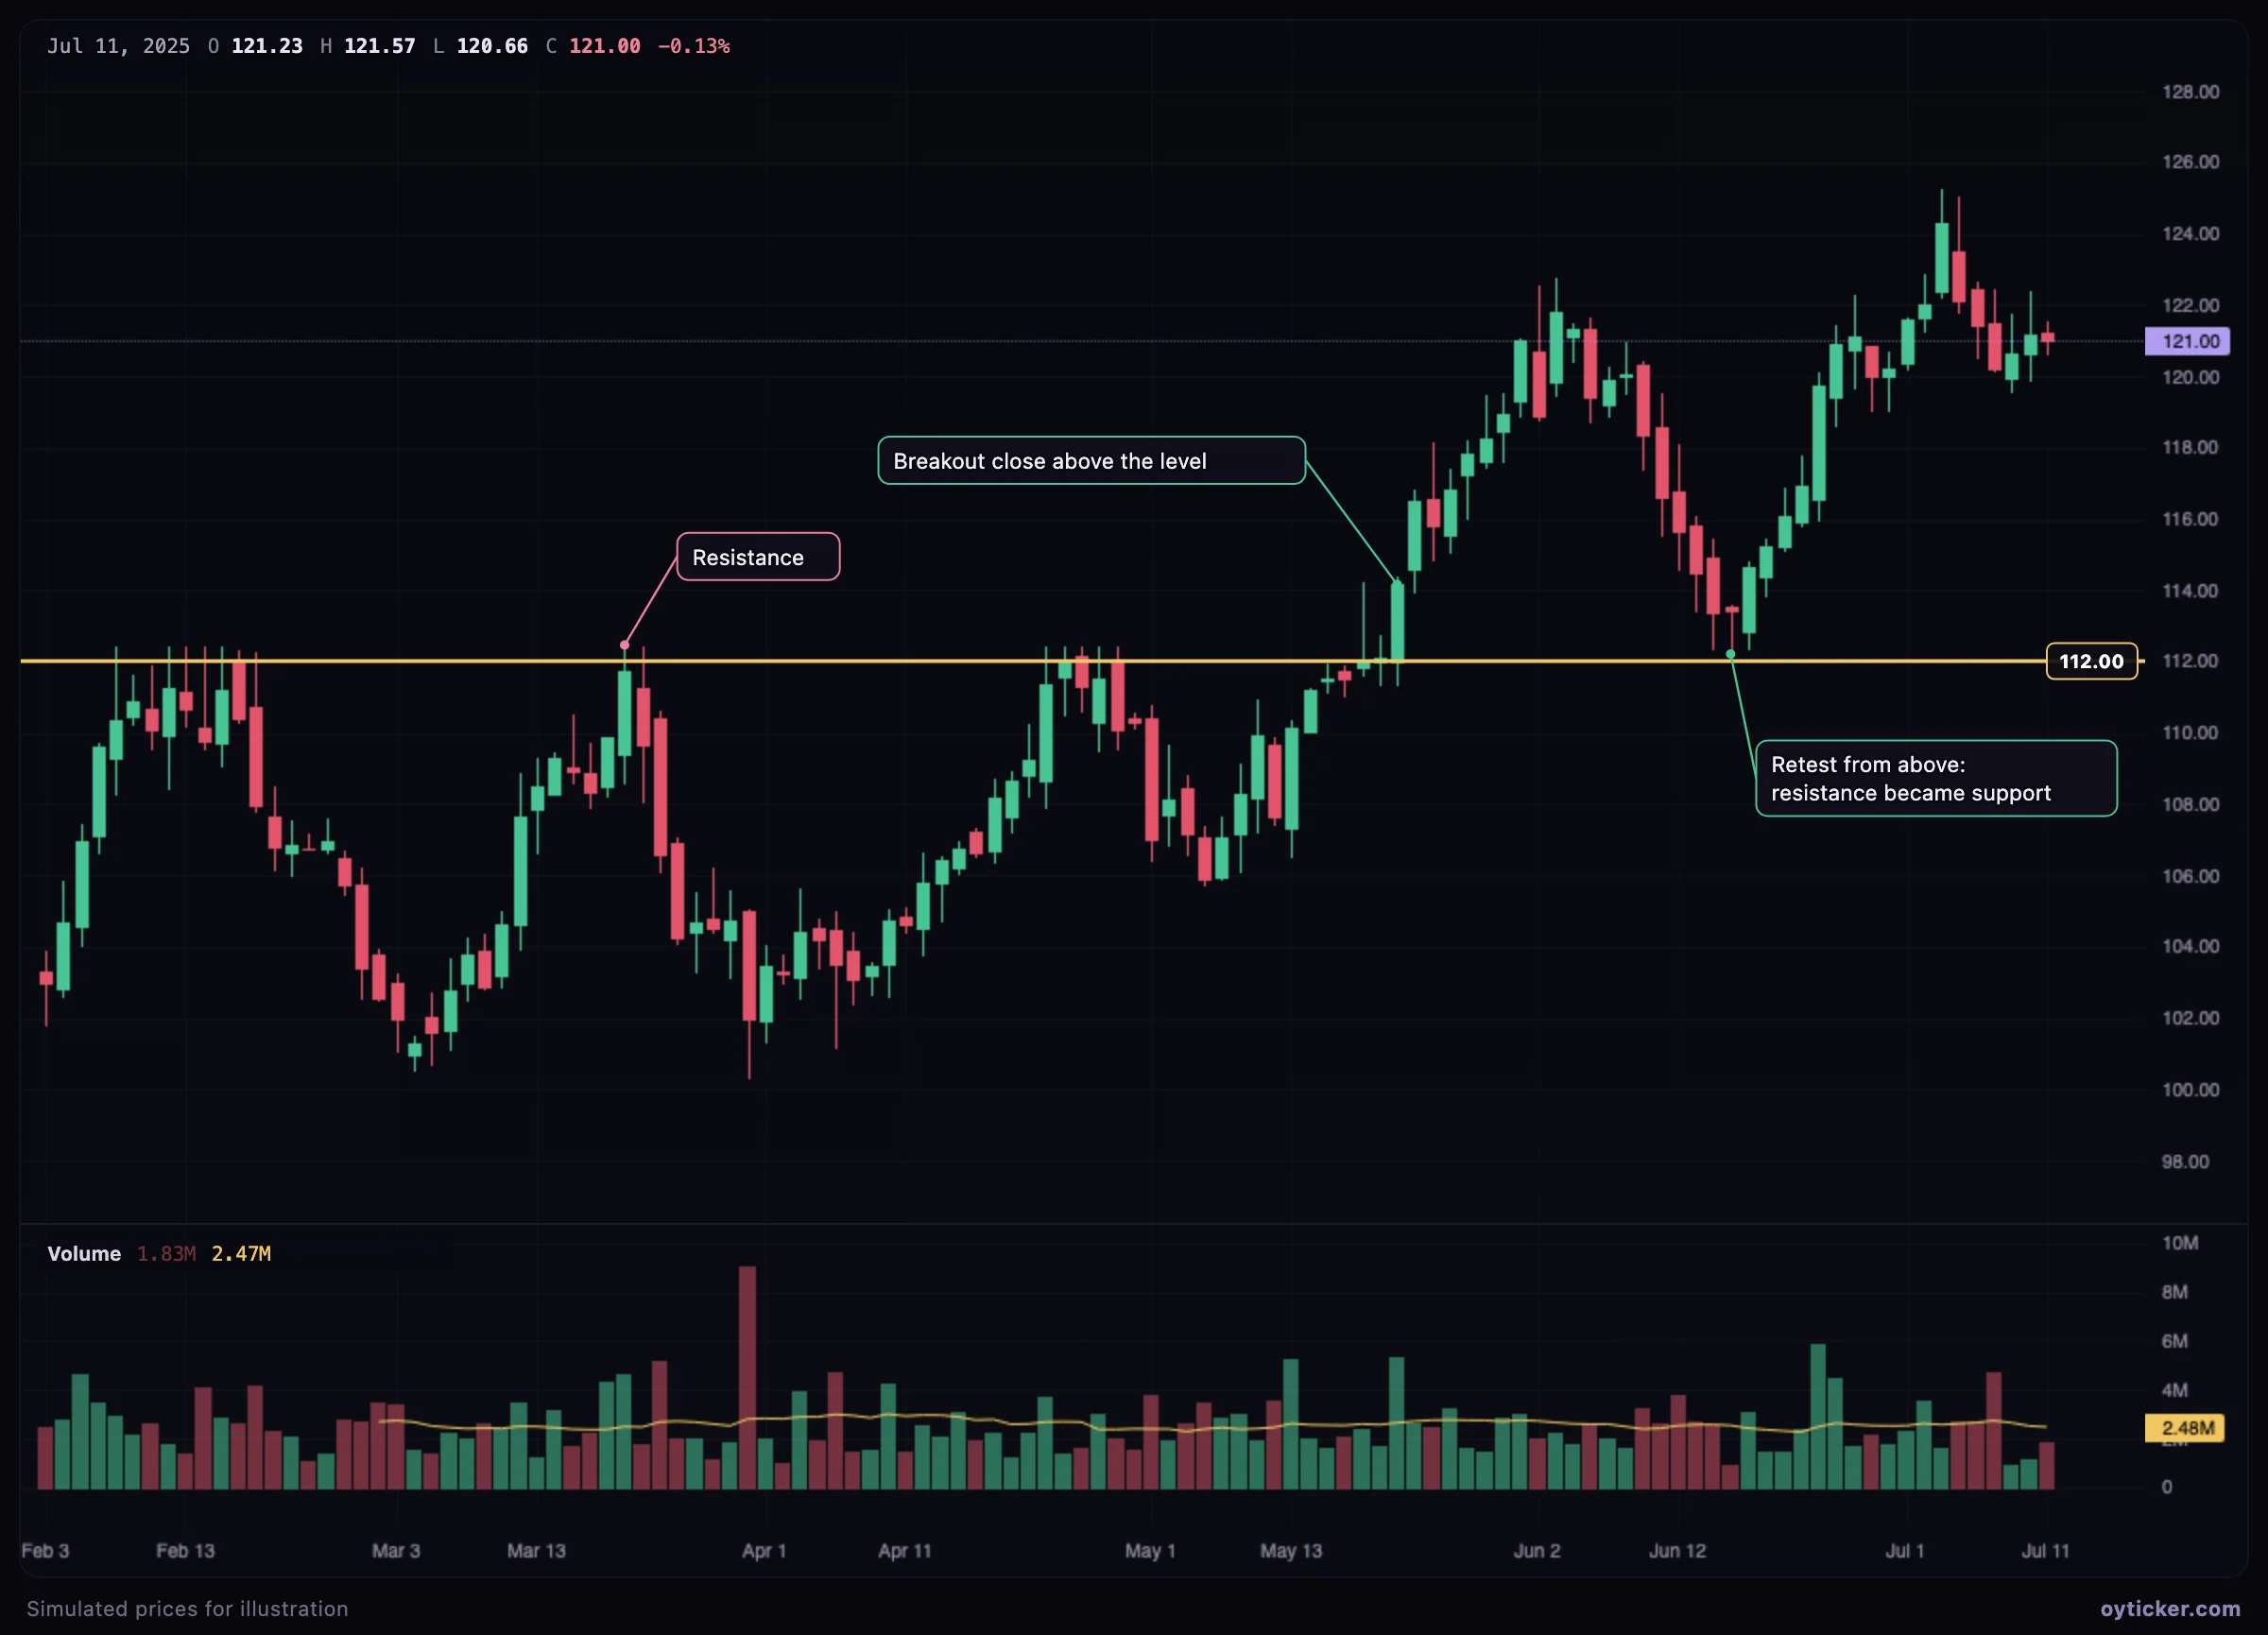
- Wait for a close above resistance: intraday pokes above a level that close back below it are failed breakouts.
- The retest gives a defined risk: a close back below the level invalidates the breakout.
- A breakout that never retests is common in strong markets; chasing it means accepting a wider stop.
Limits and common mistakes
- Too many levels. A chart with fifteen lines has a level everywhere and therefore none that matters. Keep the levels with the clearest reactions.
- Each test weakens a level. Every test absorbs part of the orders resting there; a level tested many times in a short period is more likely to break than to hold forever.
- Context. A support level in a strong downtrend is more likely to break than the same level in an uptrend.
Charts in this guide use simulated prices generated for illustration; levels and outcomes shown are examples, not observations of a real market. Educational content only, not investment advice.