
How to read it
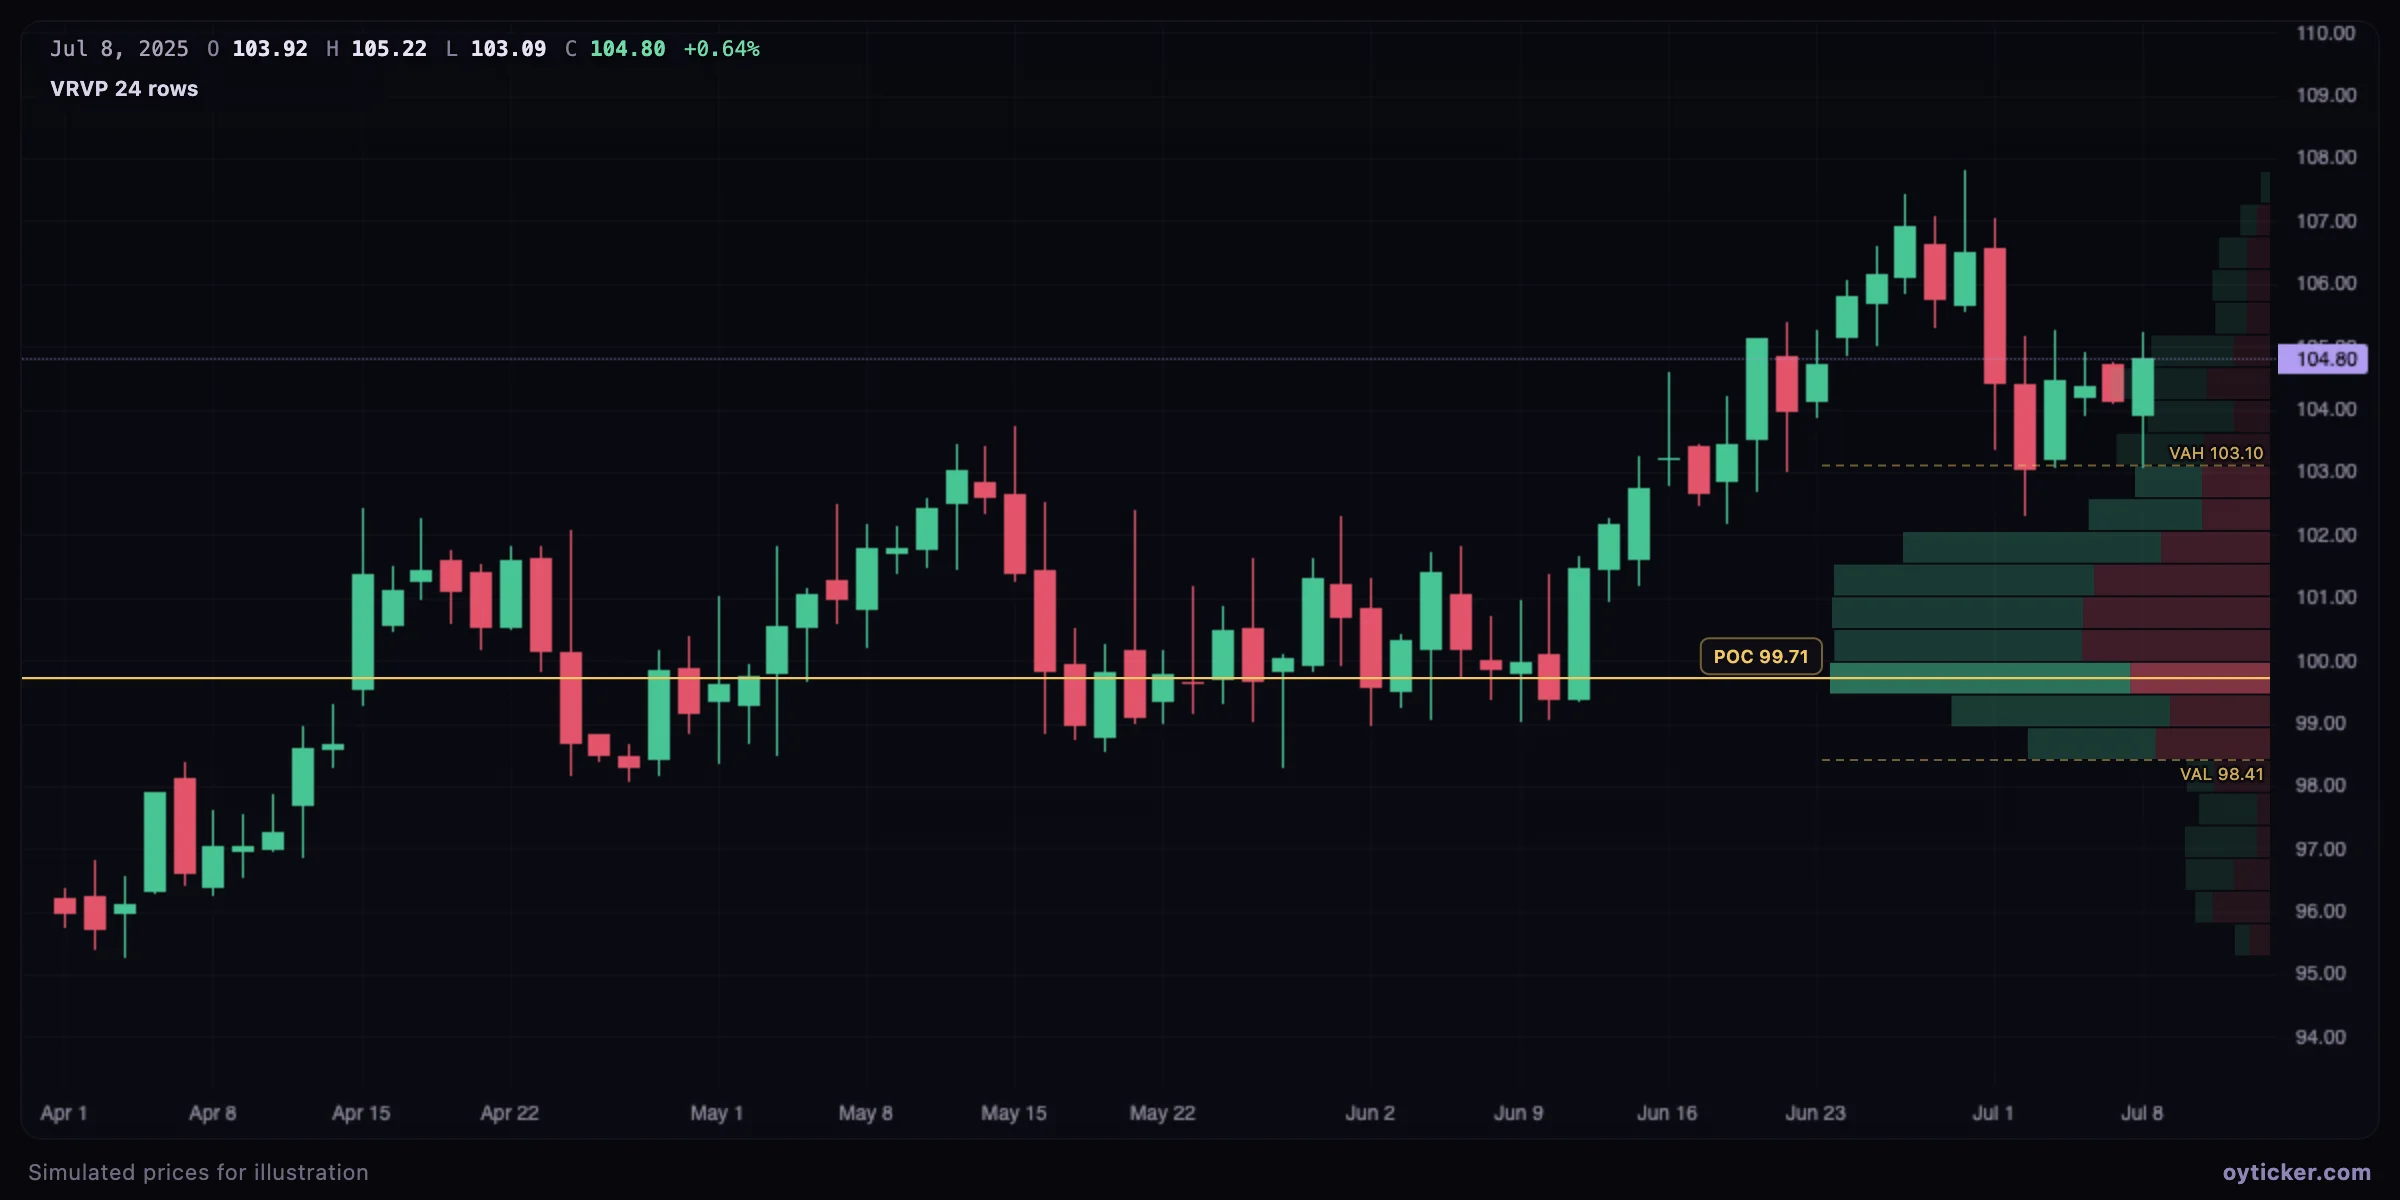
- POC: the price with the most volume; a reference that price often returns to.
- Value area (70%): the range of accepted prices; its edges (VAH, VAL) act as support and resistance.
- High-volume nodes slow price down (agreement on value); low-volume nodes are crossed quickly.
The calculation is the same as the fixed range volume profile: each bar's volume is spread over the rows its range covers, and the value area grows from the POC by pairs of rows. Green and red split the volume by candle direction, not by buyer or seller initiative.
Limits
The profile depends on what is on screen: zoom or scroll and it changes. For a profile of a specific period (a range, a trend leg), use the fixed range tool instead.
Charts in this guide use simulated prices generated for illustration; levels and outcomes shown are examples, not observations of a real market. Educational content only, not investment advice.