
Confirming a breakout
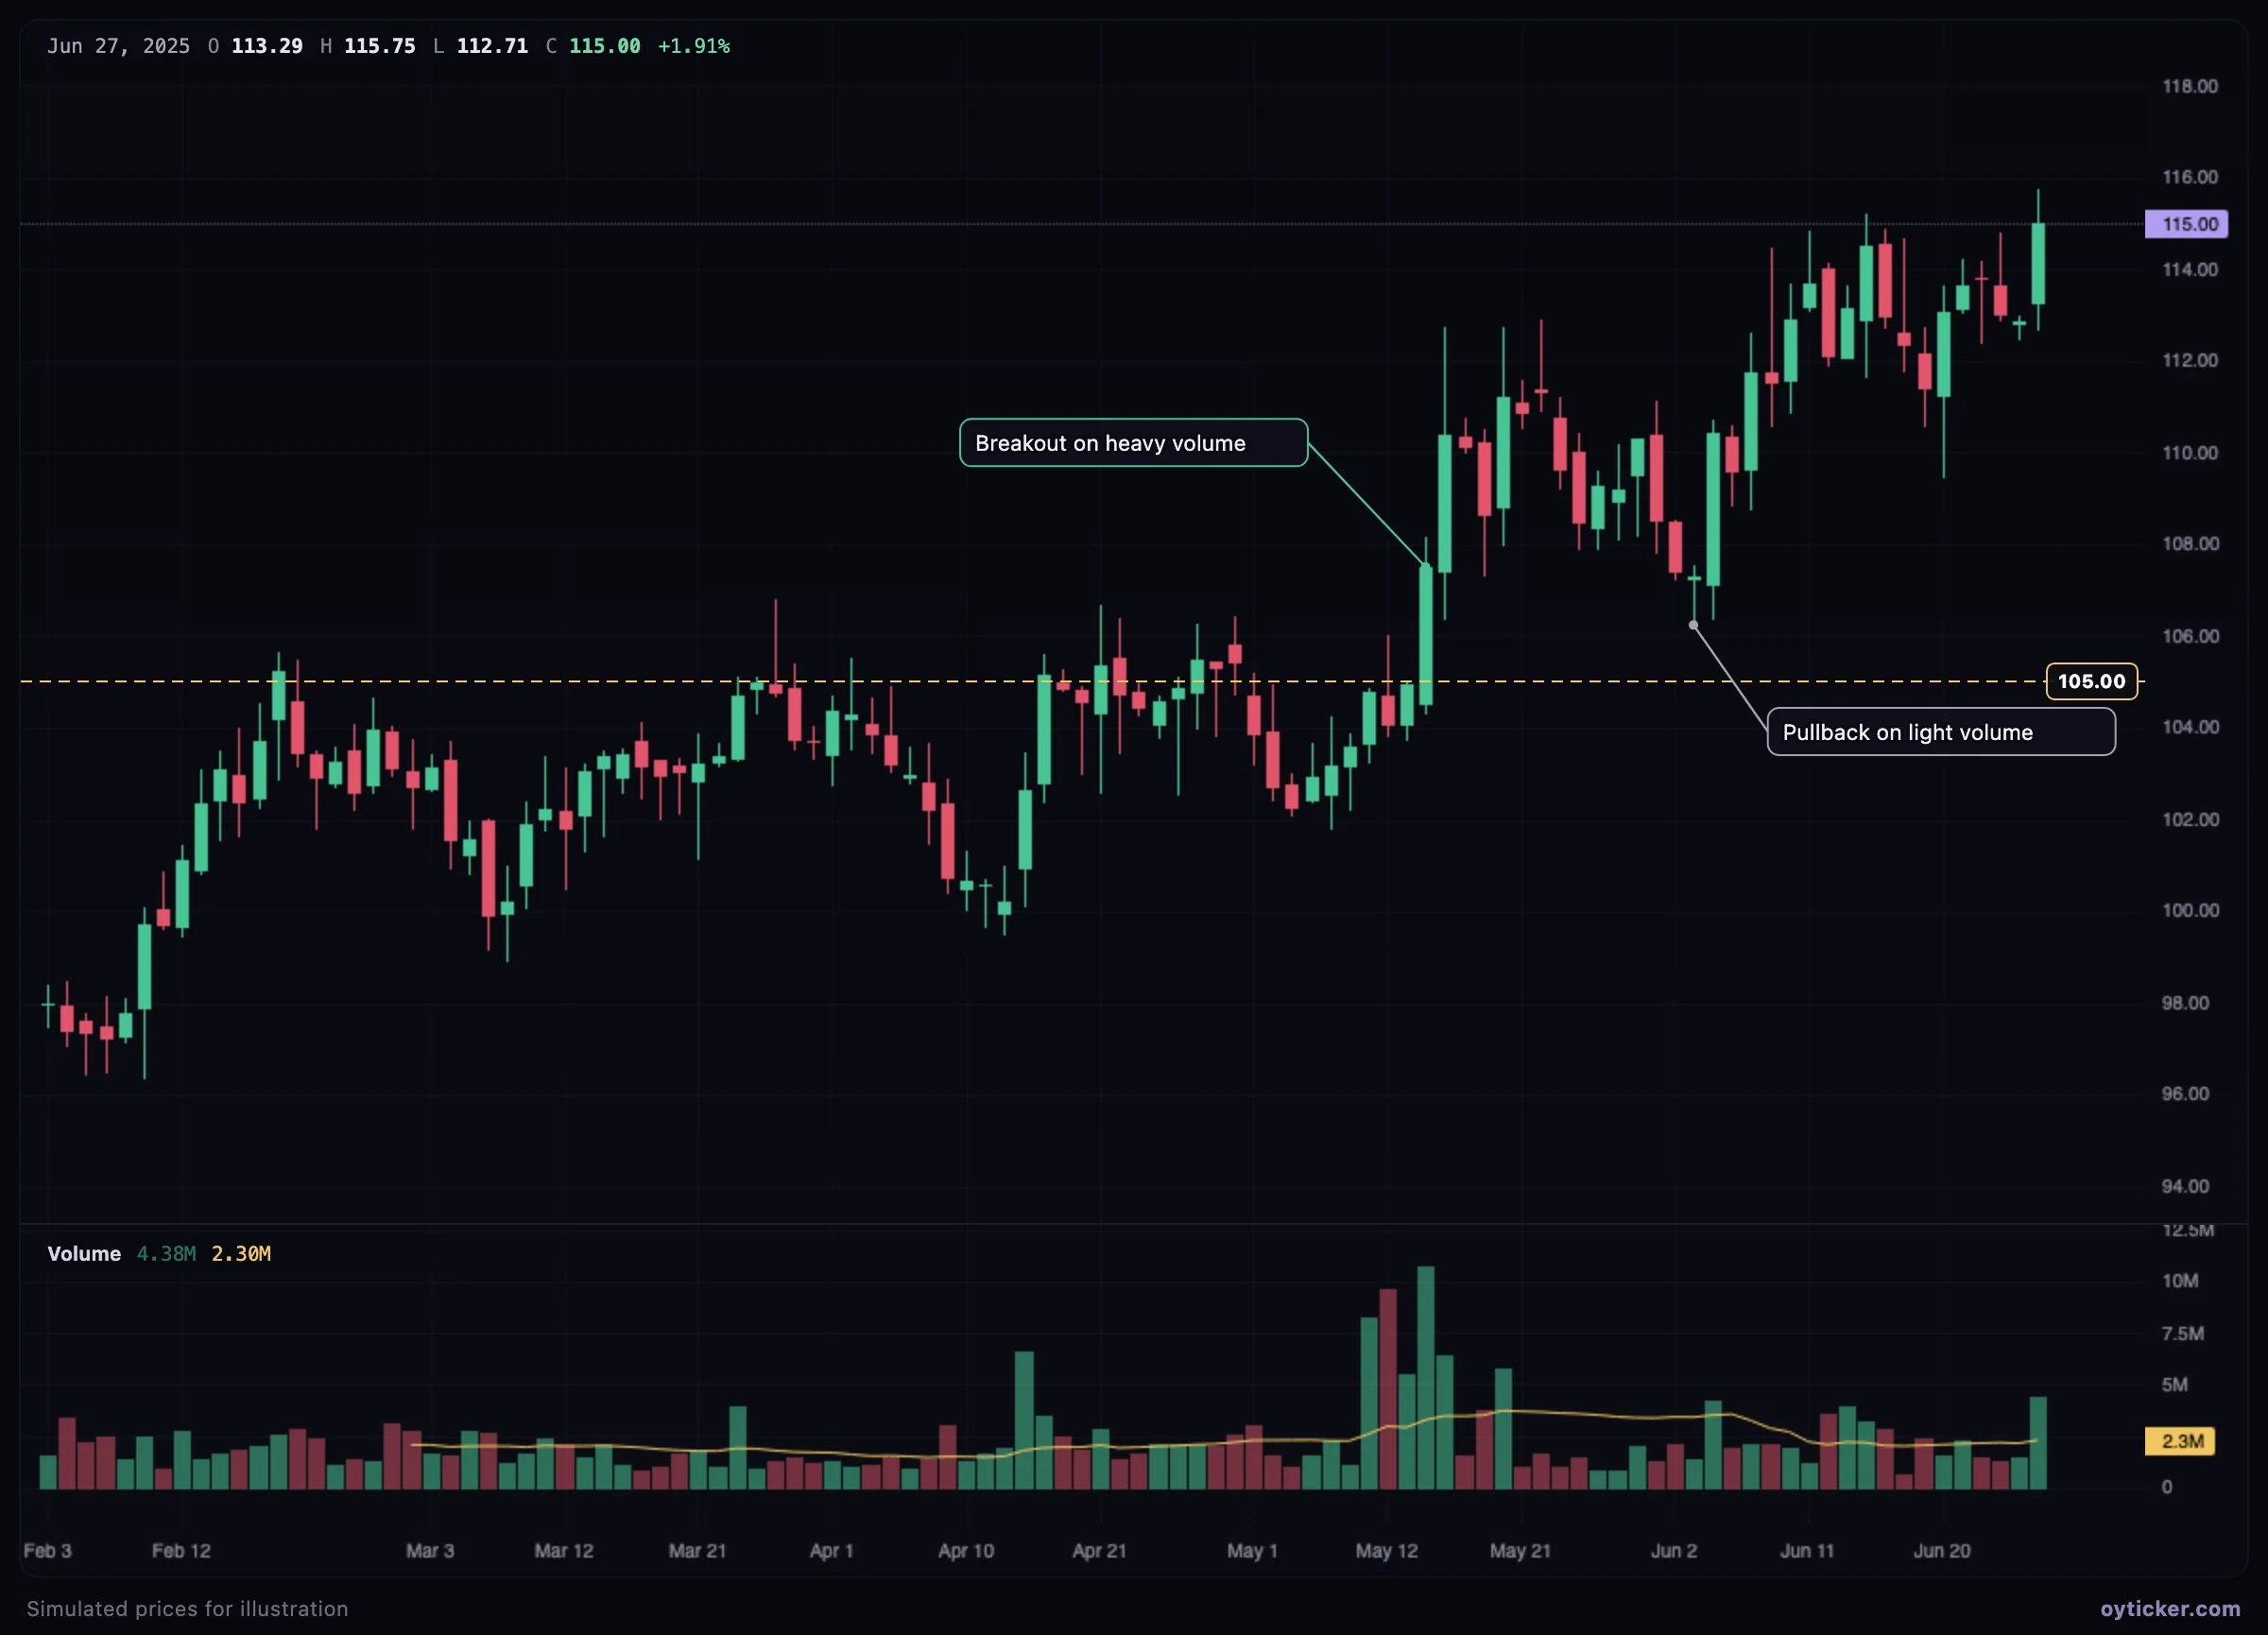
- Expanding volume on a breakout shows demand absorbing the supply at resistance.
- Light volume on pullbacks within a trend means sellers are not committed.
- A breakout on weak volume is more often a false breakout.
Case study: a selling climax
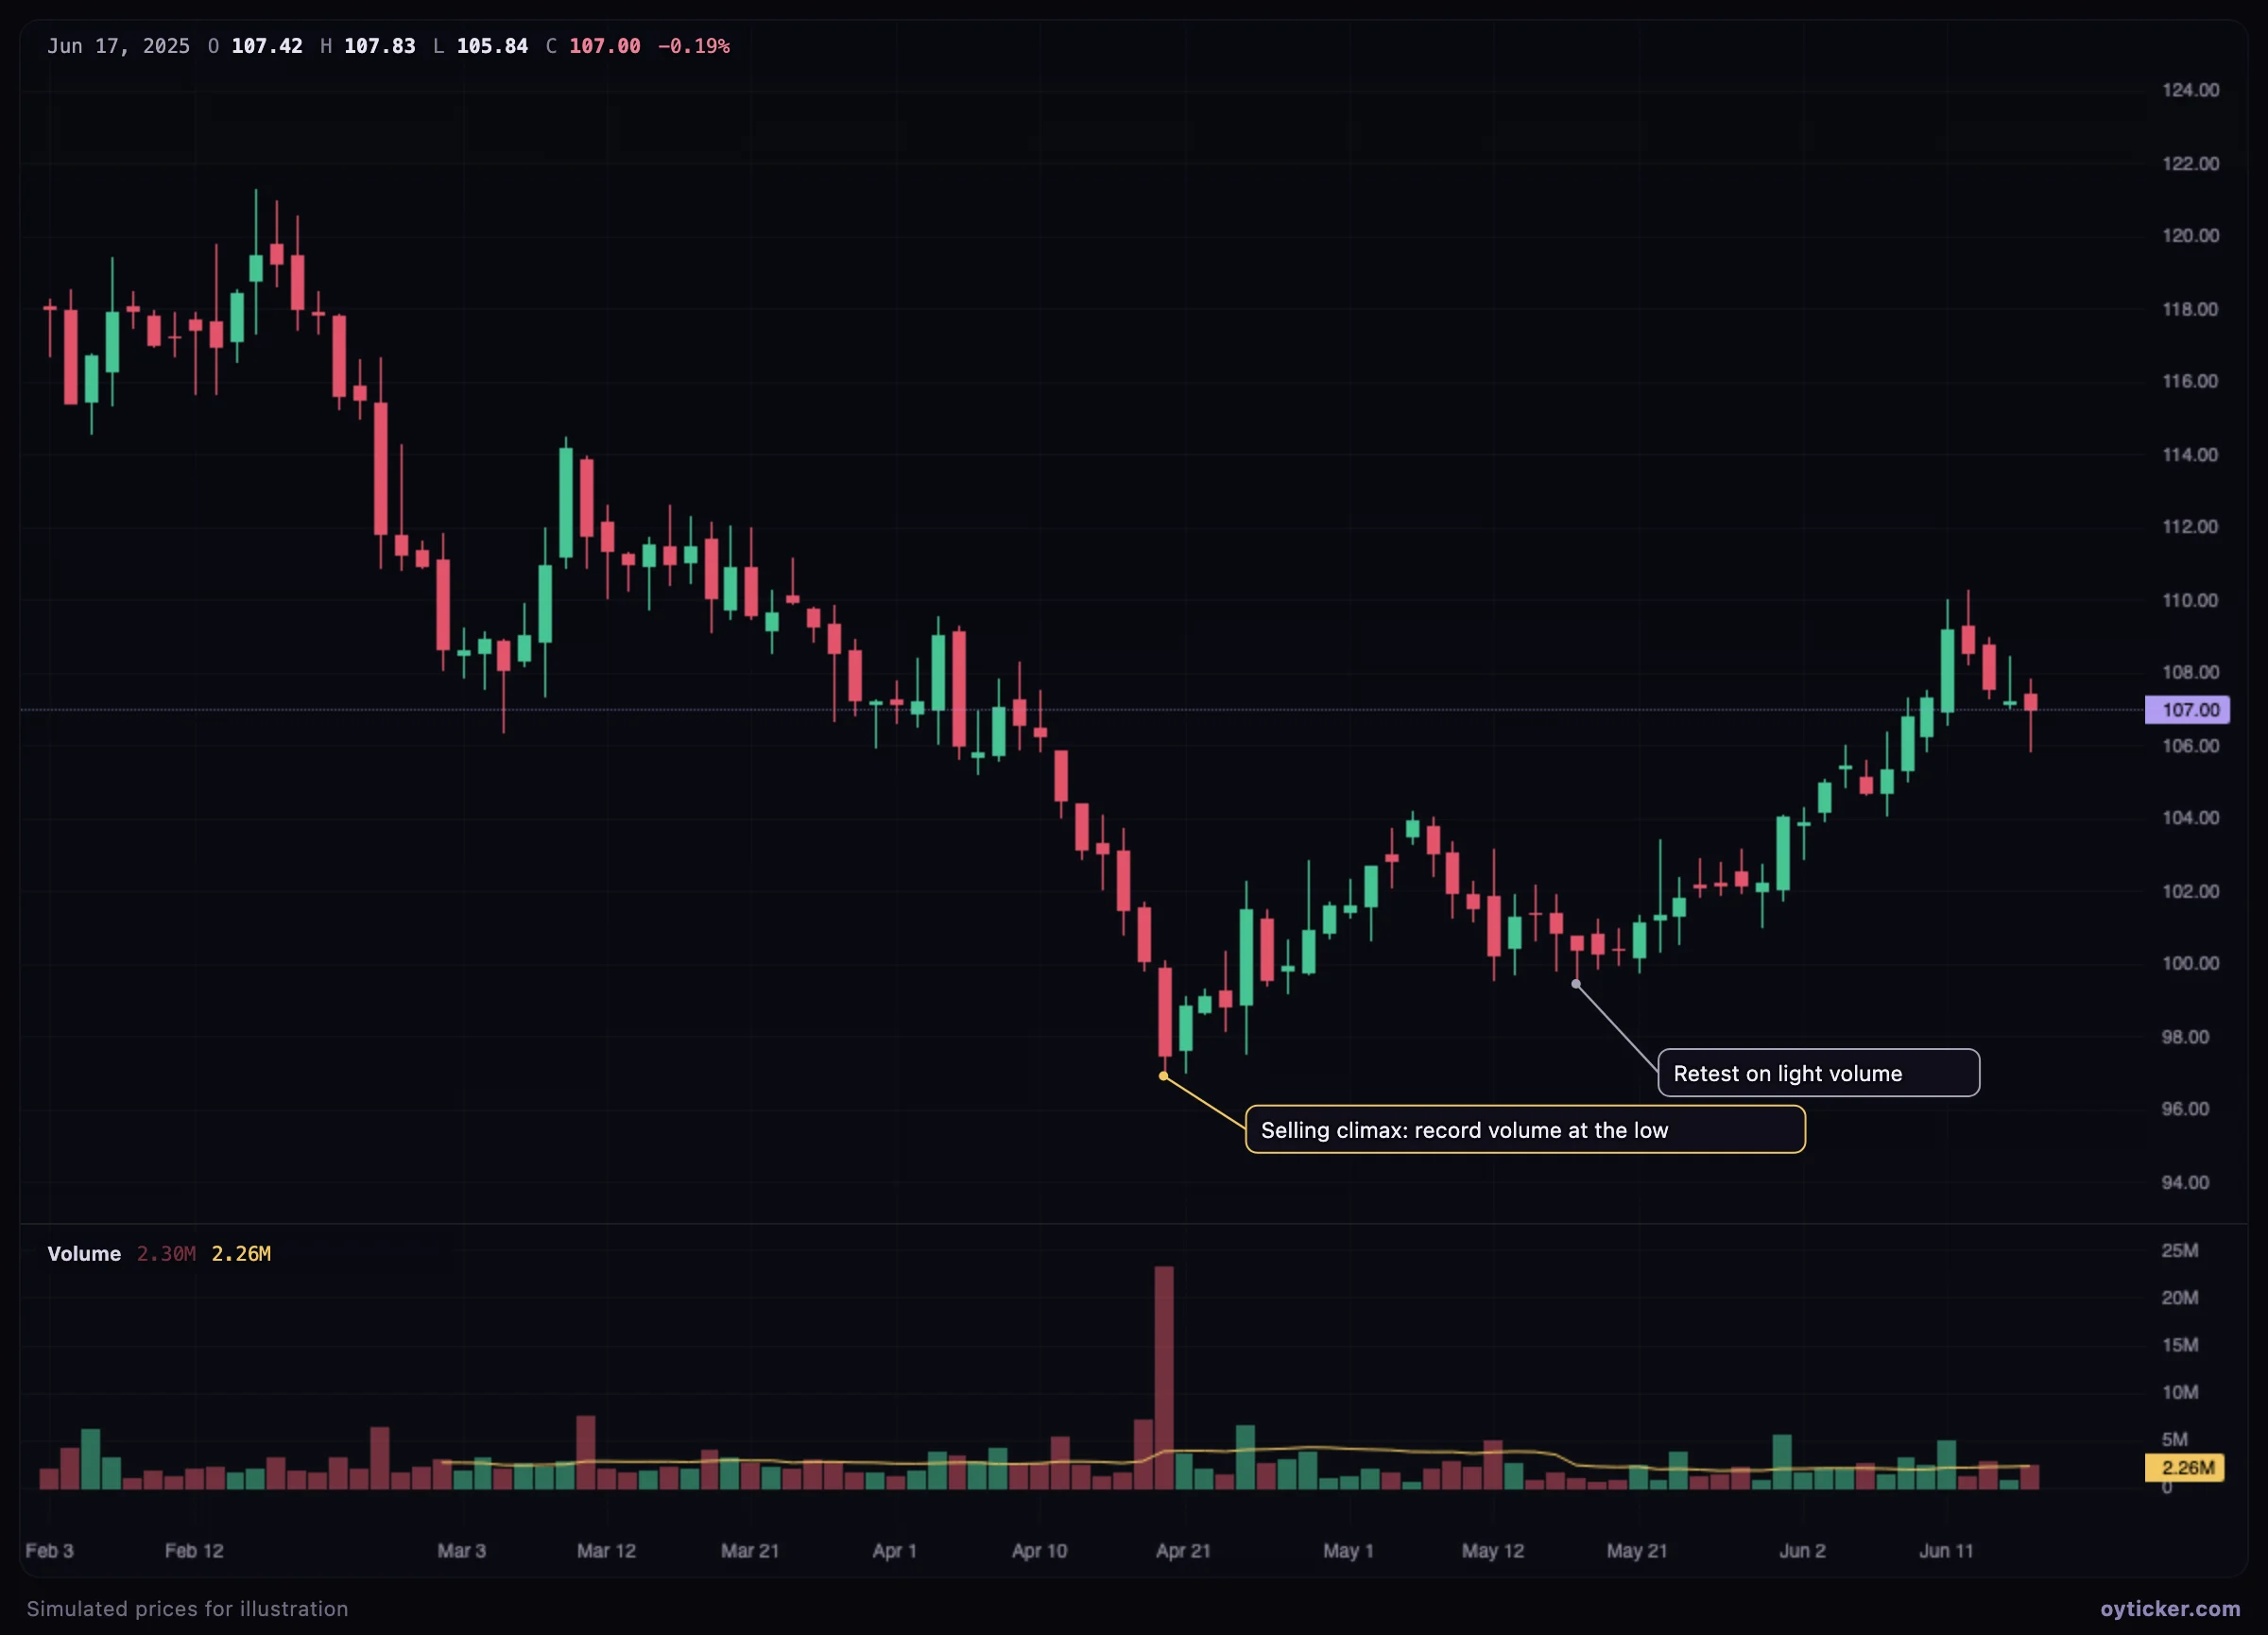
Climaxes mark exhaustion more often than continuation, but only in hindsight: a volume spike during a decline can also be the start of heavier selling. The retest on lighter volume is what confirms that the supply was exhausted.
Limits
- The green and red colors only follow the candle's direction; they do not separate buyer- and seller-initiated volume.
- Volume for stocks covers the exchanges reported by the data provider. On the 1D view, the most recent minutes can come from a single-venue real-time feed; those bars are drawn faded and a note explains it.
- Volume levels change over time (index inclusion, splits); compare a bar with its recent average rather than with distant history.
Charts in this guide use simulated prices generated for illustration; levels and outcomes shown are examples, not observations of a real market. Educational content only, not investment advice.