
How it is built
- The range between the lowest low and the highest high of the selected bars is divided into equal price rows.
- Each bar's volume is spread over the rows its high–low range covers, in proportion to the overlap. This is the standard method when a profile is built from candles rather than individual trades; on the 1D view, built from 1-minute bars, it is close to the traded distribution.
- POC: the row with the most volume.
- Value area (70%): starting from the POC, the two rows above or the two rows below with the larger volume are added, repeatedly, until 70% of the total is included (the CBOT Market Profile method). Its top is the VAH, its bottom the VAL.
How to read it
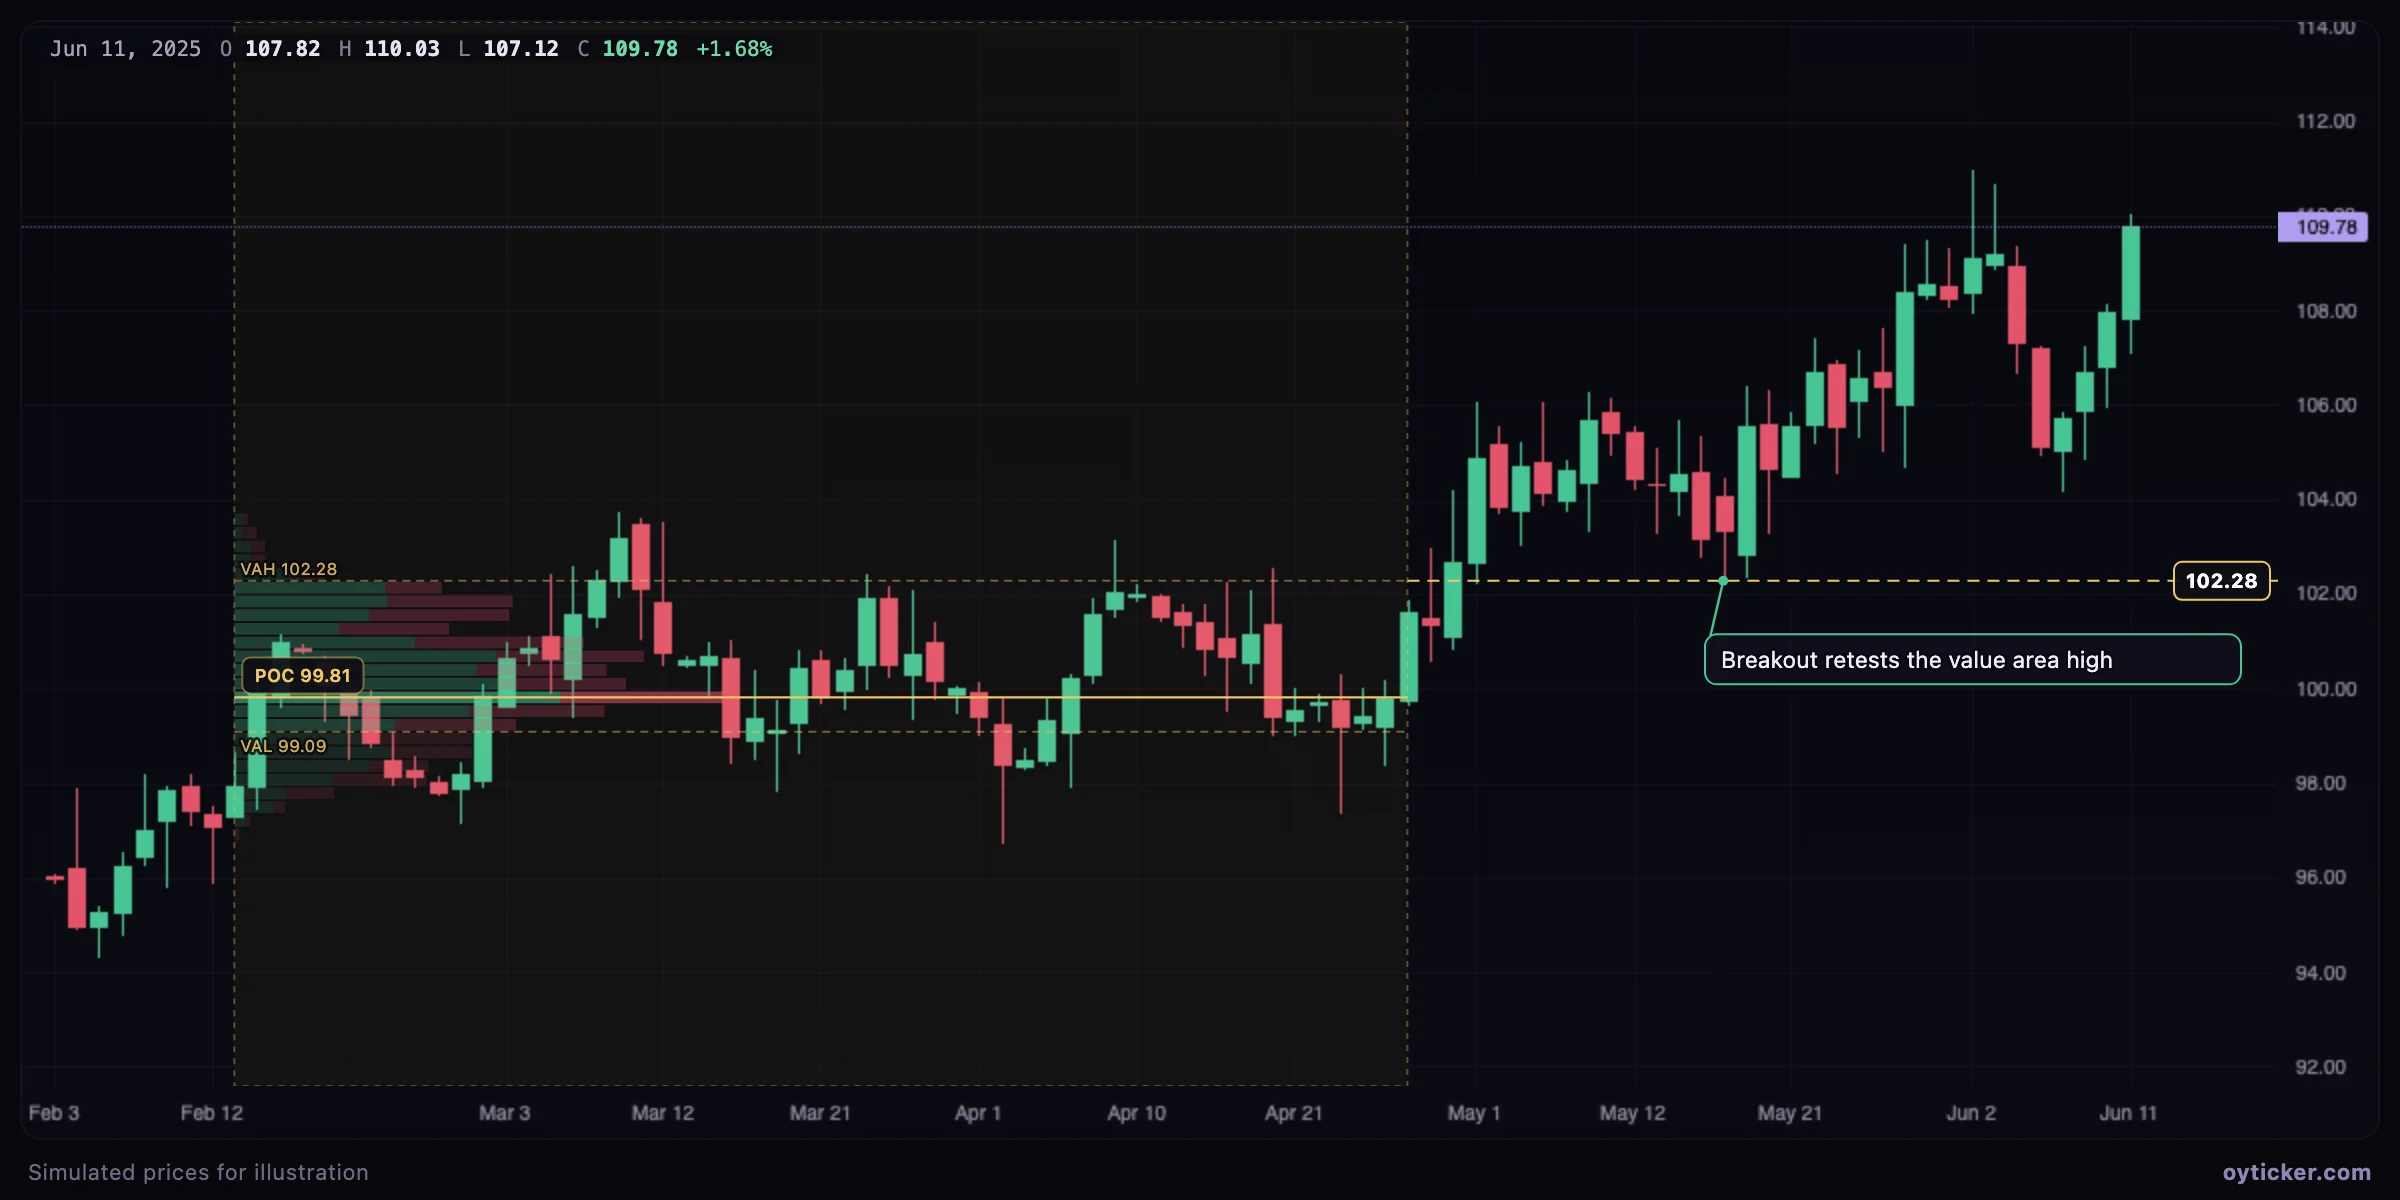
- POC: a magnet in balanced markets and a strong reference after a breakout: price returning to it tests whether the new value is accepted.
- Inside the value area the market is in balance; trades toward the POC are favored.
- Outside it, a move that is accepted (time spent there, volume building) establishes new value; a quick rejection sends price back inside, often to the opposite side of the value area.
- Low-volume rows (thin parts of the profile) are prices the market moved through quickly; price tends to travel through them fast again.
How to draw it
- Choose Volume-based → Fixed range volume profile.
- Click the first bar of the range, then the last one. The profile is drawn inside the selected period.
- Choose the number of rows in the options: fewer rows for a broad picture, more for detail.
For a profile that follows whatever is on screen, use the visible range volume profile indicator.
Charts in this guide use simulated prices generated for illustration; levels and outcomes shown are examples, not observations of a real market. Educational content only, not investment advice.