
Calculation
typical price  tp = (high + low + close) / 3
AVWAP          = Σ(tp × volume) / Σ(volume)          from the anchor bar to the current bar
σ              = √( Σ(tp² × volume) / Σ(volume) − AVWAP² )
bands          = AVWAP ± 1σ, AVWAP ± 2σ
Sums start on the anchor bar itself. The σ bands are the volume-weighted standard deviation of the typical price around the AVWAP.
Unlike the session VWAP, which restarts every day, an anchored VWAP never resets: it accumulates every bar since the anchor. The idea, popularized by Brian Shannon, is that the anchor should be a moment that changed the market's mind.
How to read it
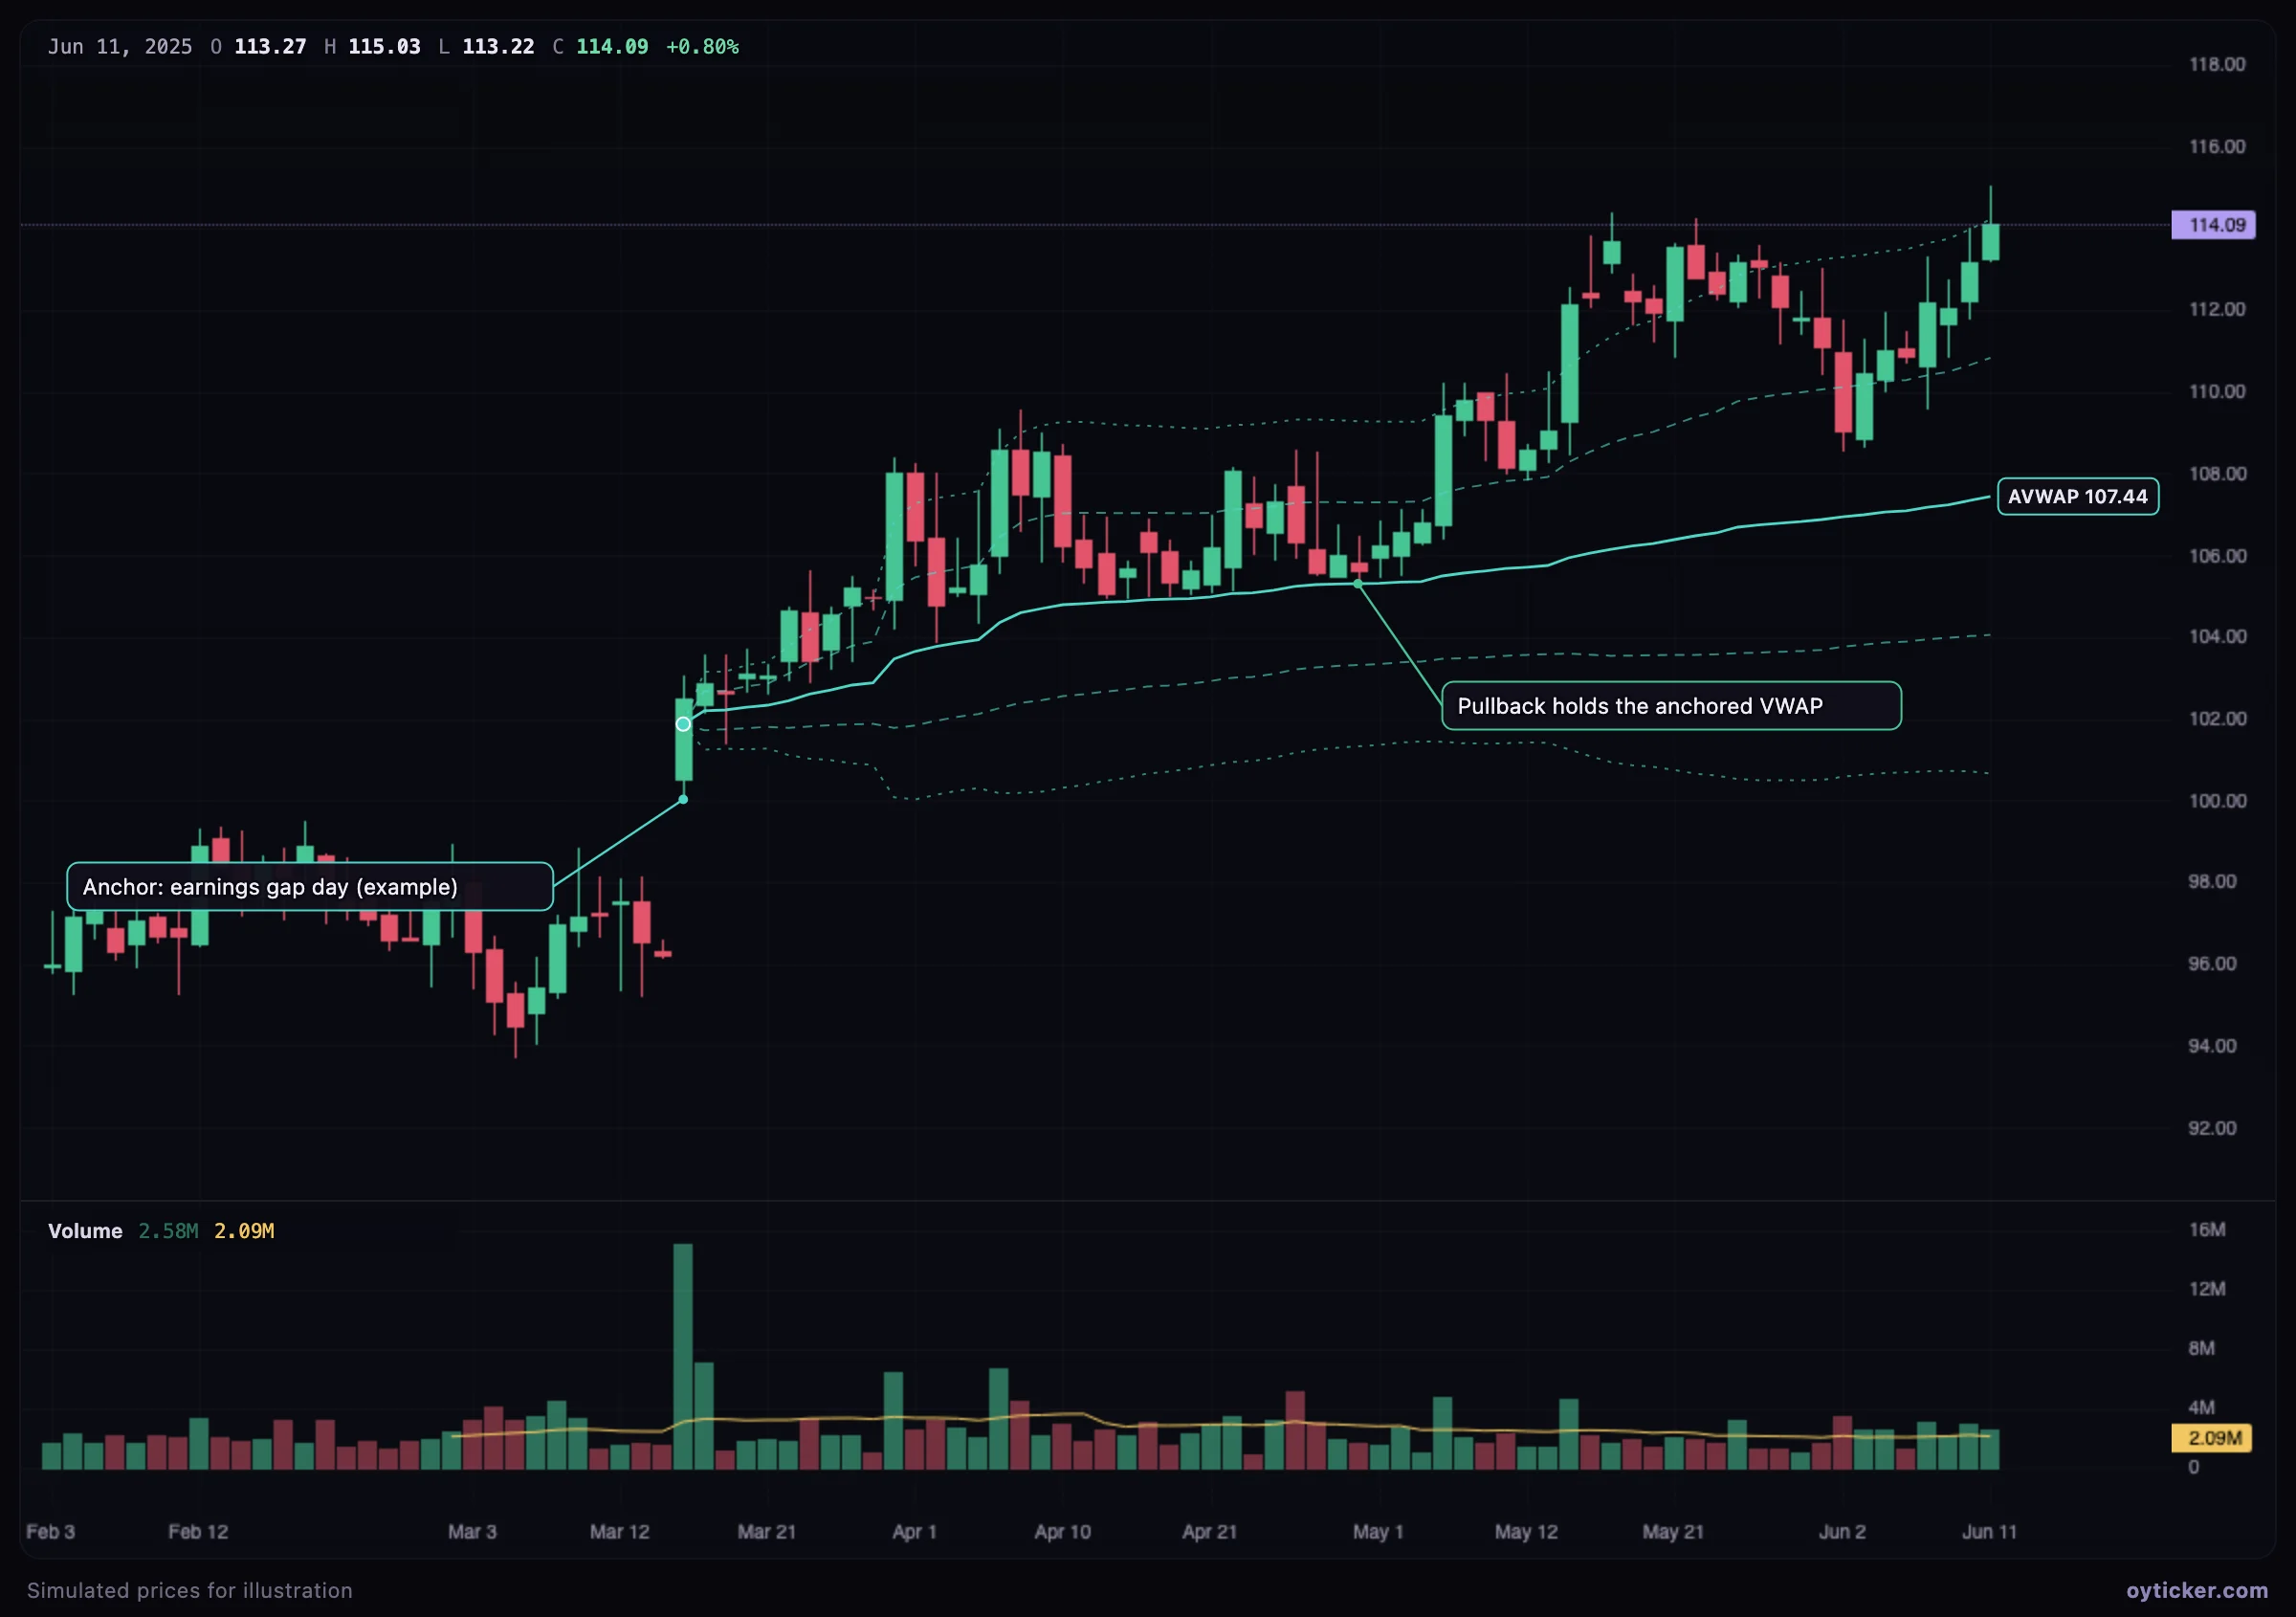
- Above the AVWAP: the average participant since the anchor is in profit; pullbacks to it are watched as support.
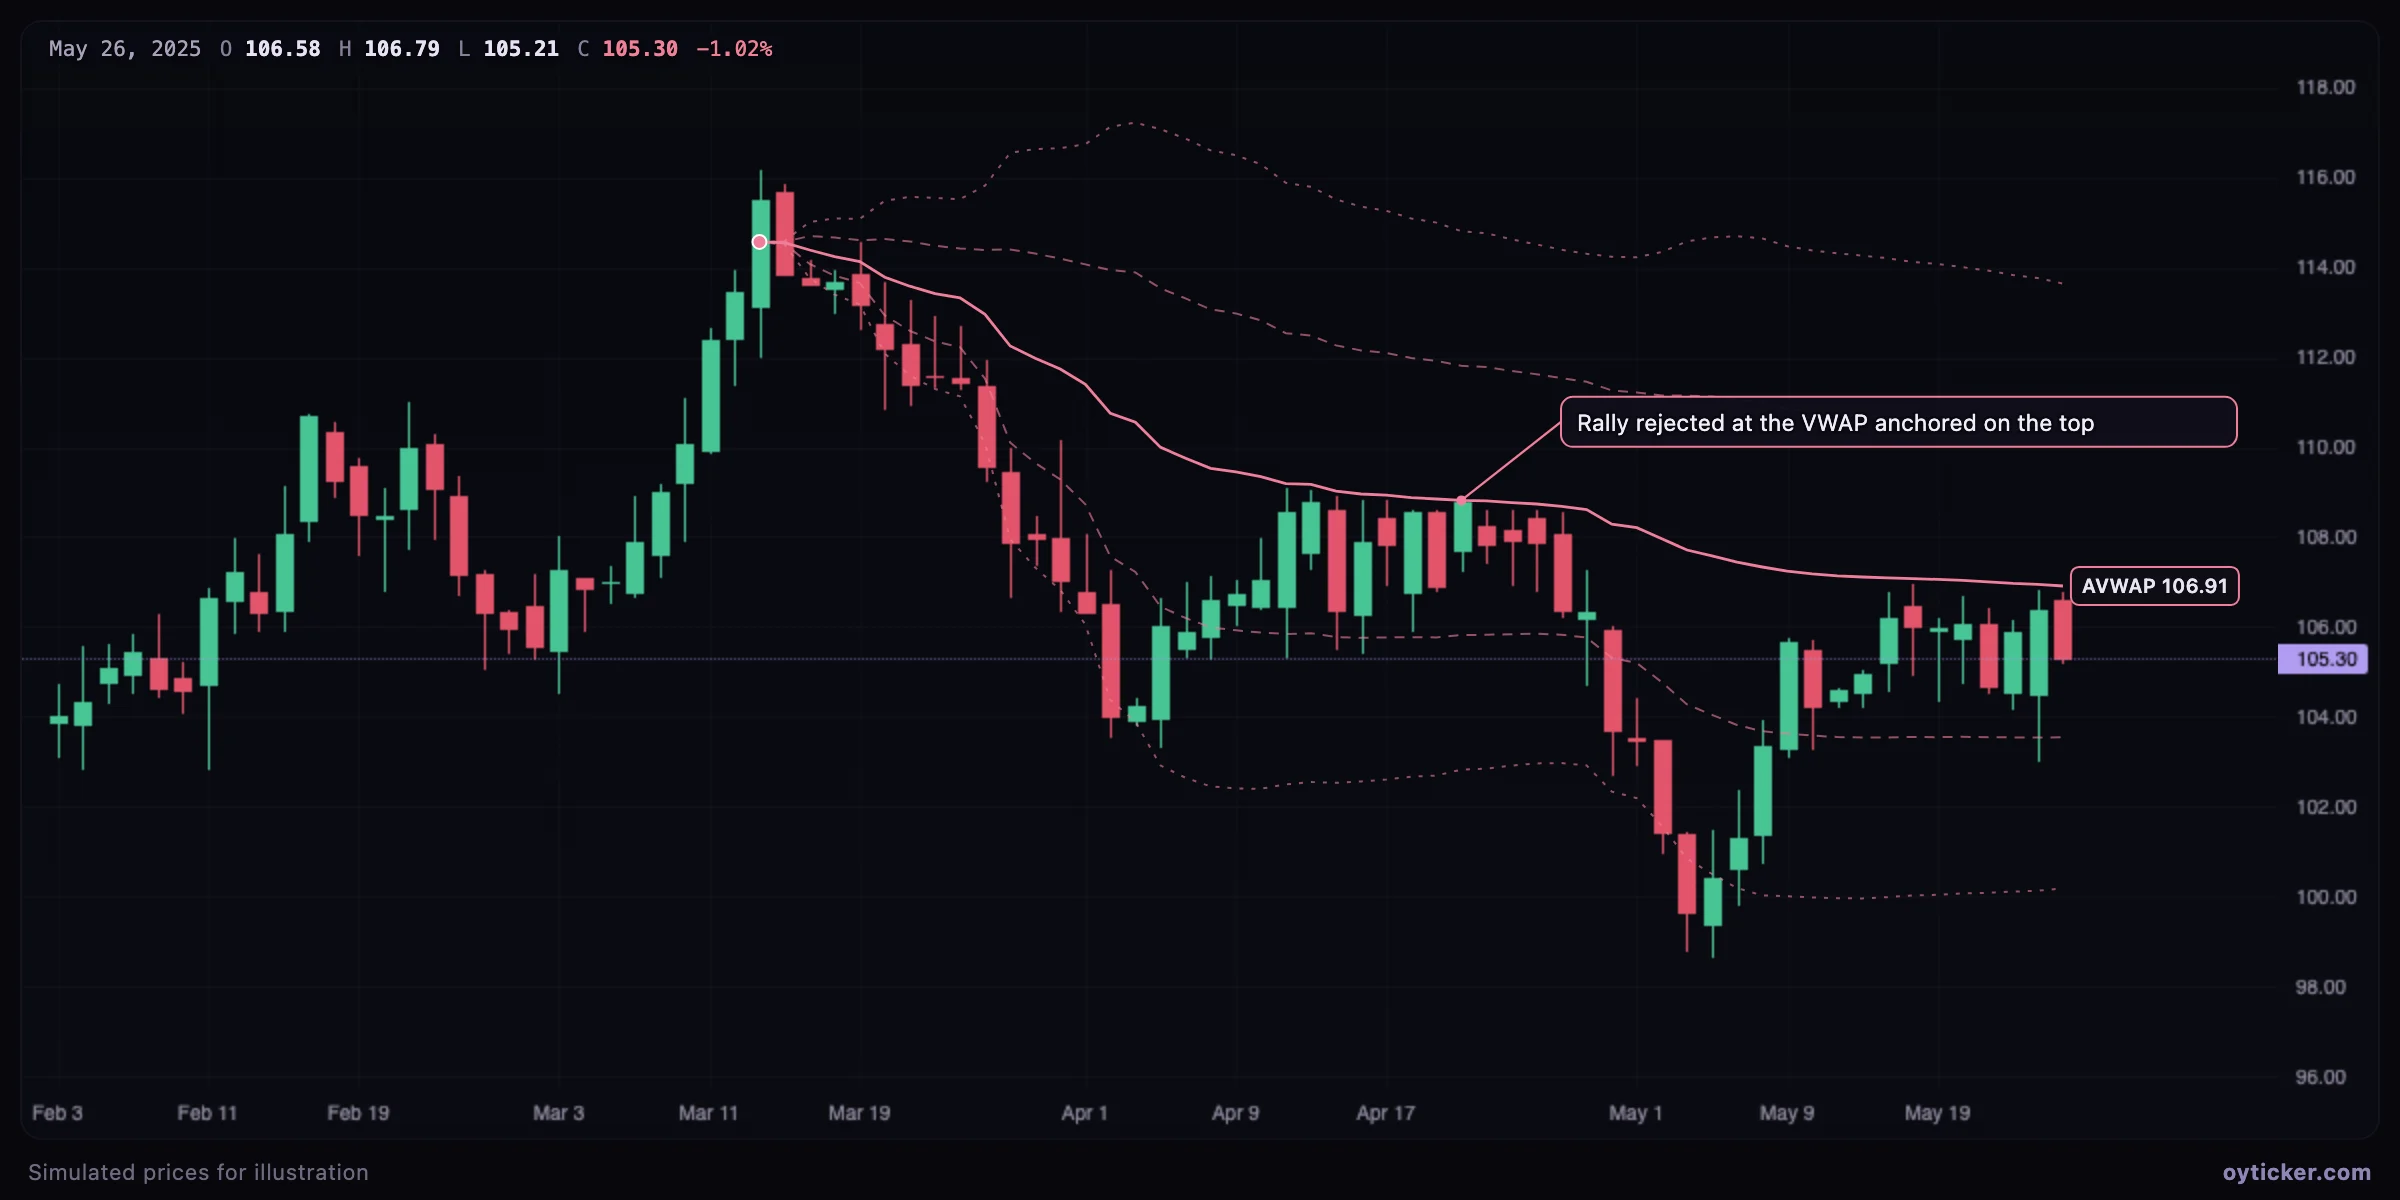
- Below it: the average participant is losing; rallies to it often meet selling from those who want to exit at breakeven.
- Several anchors (the last earnings, the yearly high, the last major low) show who is in control over different horizons.
How to draw it
- Choose Volume-based → Anchored VWAP.
- Click the anchor bar. The handle sits on the AVWAP's first value (the anchor bar's typical price); drag it to another bar to re-anchor.
- Untick σ bands in the options to show only the AVWAP.
Limits
- The result depends on the volume data: on the 1D view, recent stock minutes may come from a real-time feed that does not include every venue (a note says so when it applies).
- Bars without volume are ignored; an AVWAP over very illiquid data is not meaningful.
- The anchor must be justified by an event; anchoring on random bars finds random levels.
Charts in this guide use simulated prices generated for illustration; levels and outcomes shown are examples, not observations of a real market. Educational content only, not investment advice.