Drawing tools · Cycles

Cyclic lines

Cyclic lines repeat a time interval across the chart: you set one cycle with two points, and vertical lines are drawn at every multiple of it. They are used to see whether turning points recur at regular intervals and when the next one would be due.

What it's for
  • Project a regular time interval across the chart from two turning points.
  • Estimate when the next cycle low or high would be due.
Plus and Pro toolTry it in Analyze
Points
2, one cycle apart
Plan
Plus and Pro
Shows
Vertical lines and the period in bars
Extends
Into the future

Reading cycles

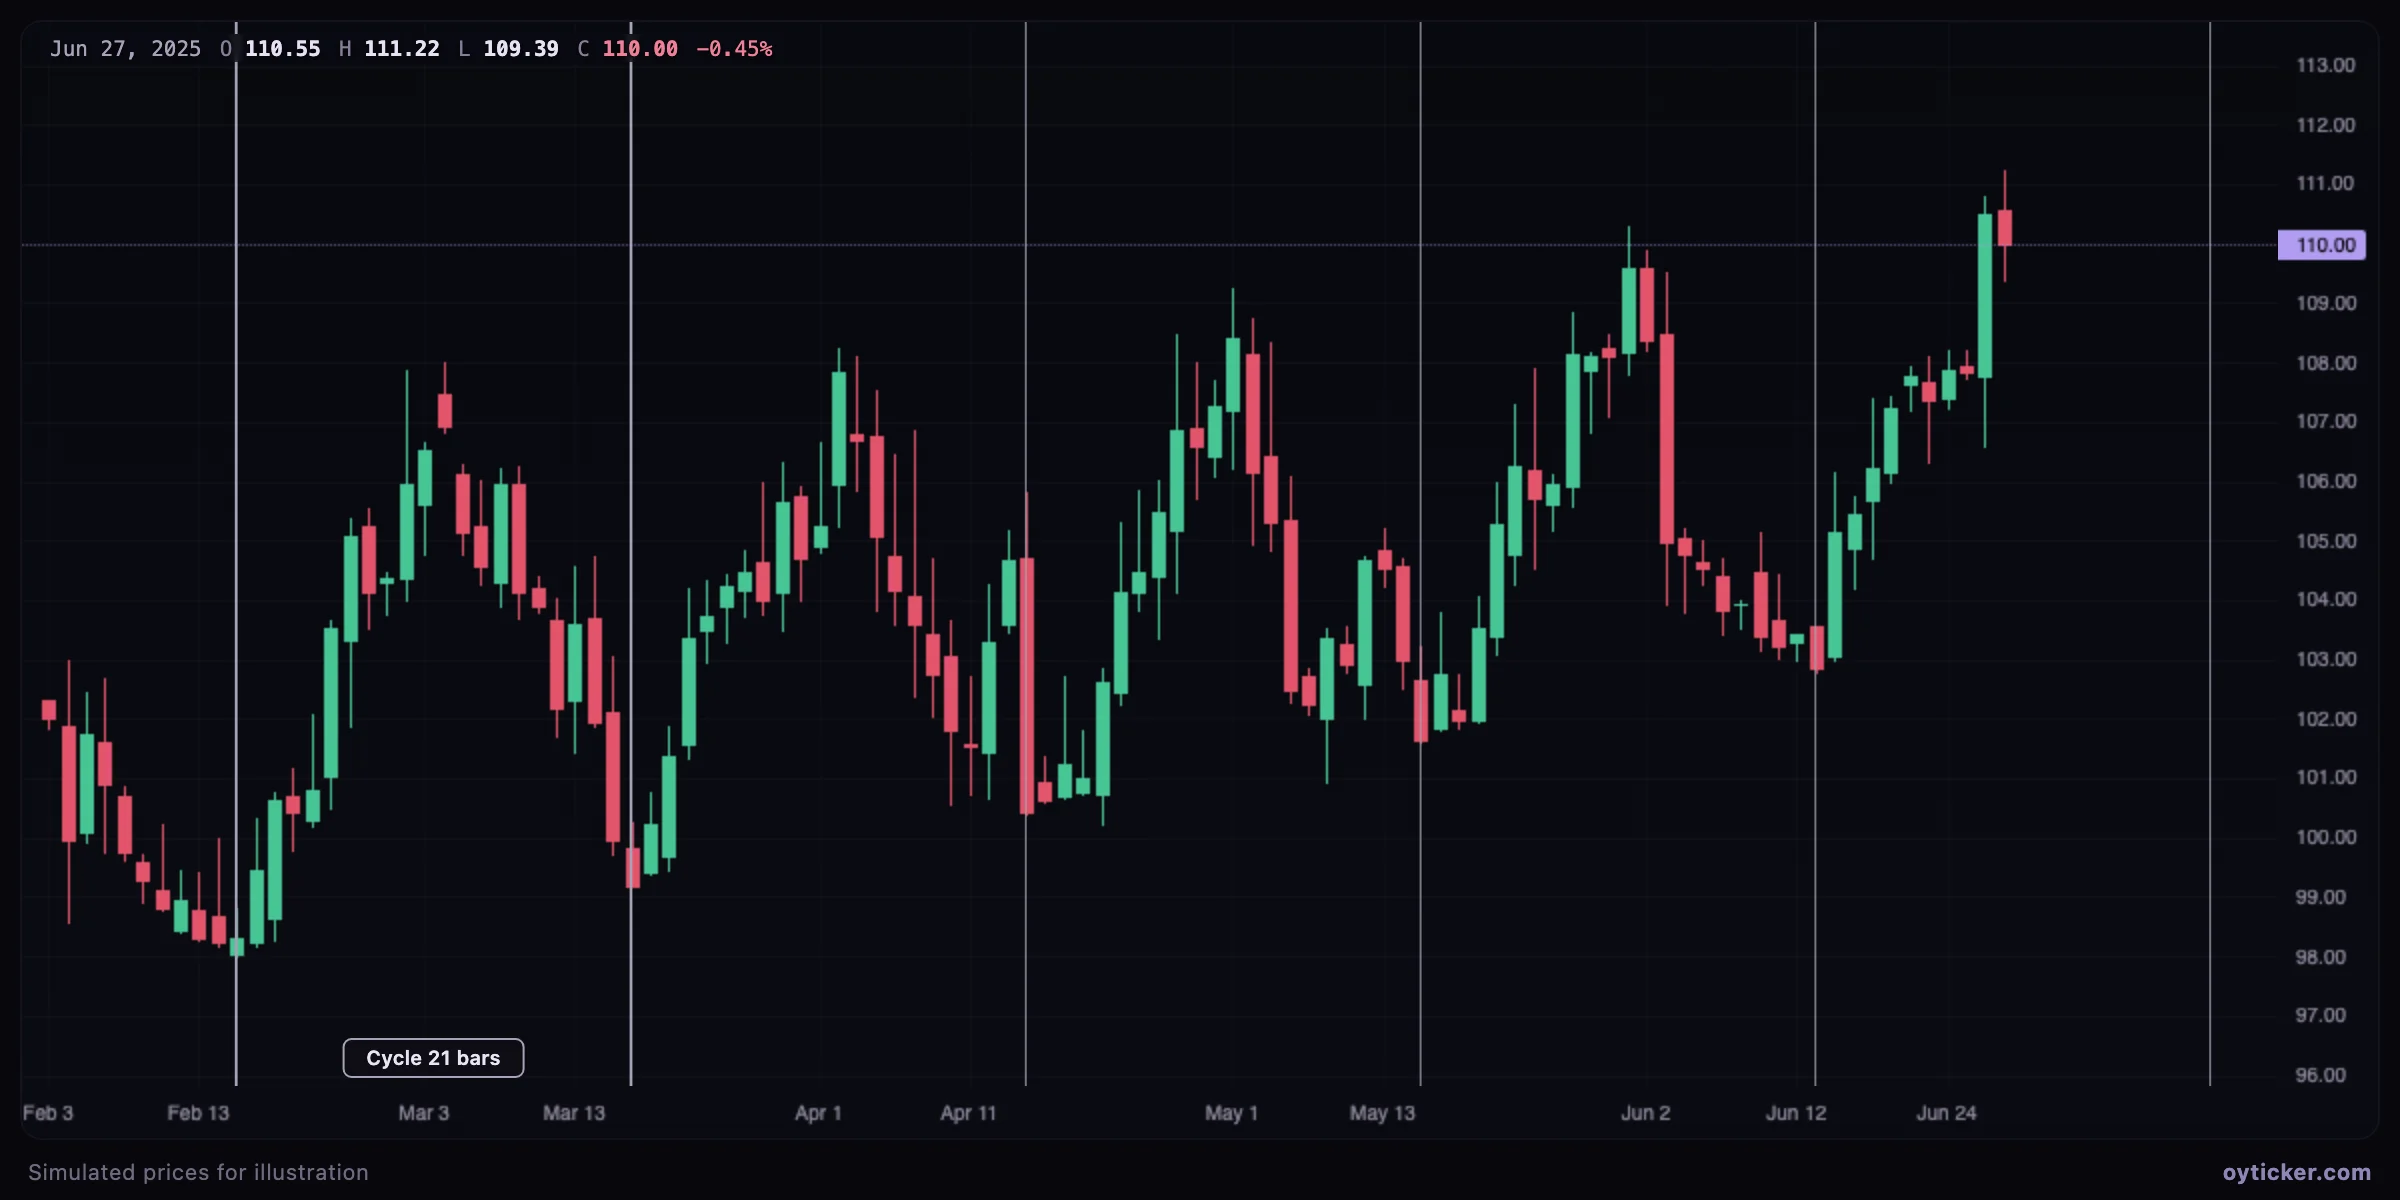
Cyclic lines every 21 bars aligned with successive swing lows
Two consecutive lows 21 bars apart define the cycle. The following lows fall on the projected lines, and the last line, to the right of the data, marks when the next low would be due.
  • Measure the cycle between two comparable turning points (two major lows, not a low and a minor dip).
  • Cycles are measured in bars: on daily charts that is trading days, not calendar days.
  • A cycle low is a time window, not a date: allow a few bars on each side.

Limits

Market cycles drift and invert; with enough lines, some will always fall near a turning point. Treat a cycle as confirmed only when it has worked several times, and act on price, not on the date.

Charts in this guide use simulated prices generated for illustration; levels and outcomes shown are examples, not observations of a real market. Educational content only, not investment advice.