Drawing tools · Cycles

Time cycles

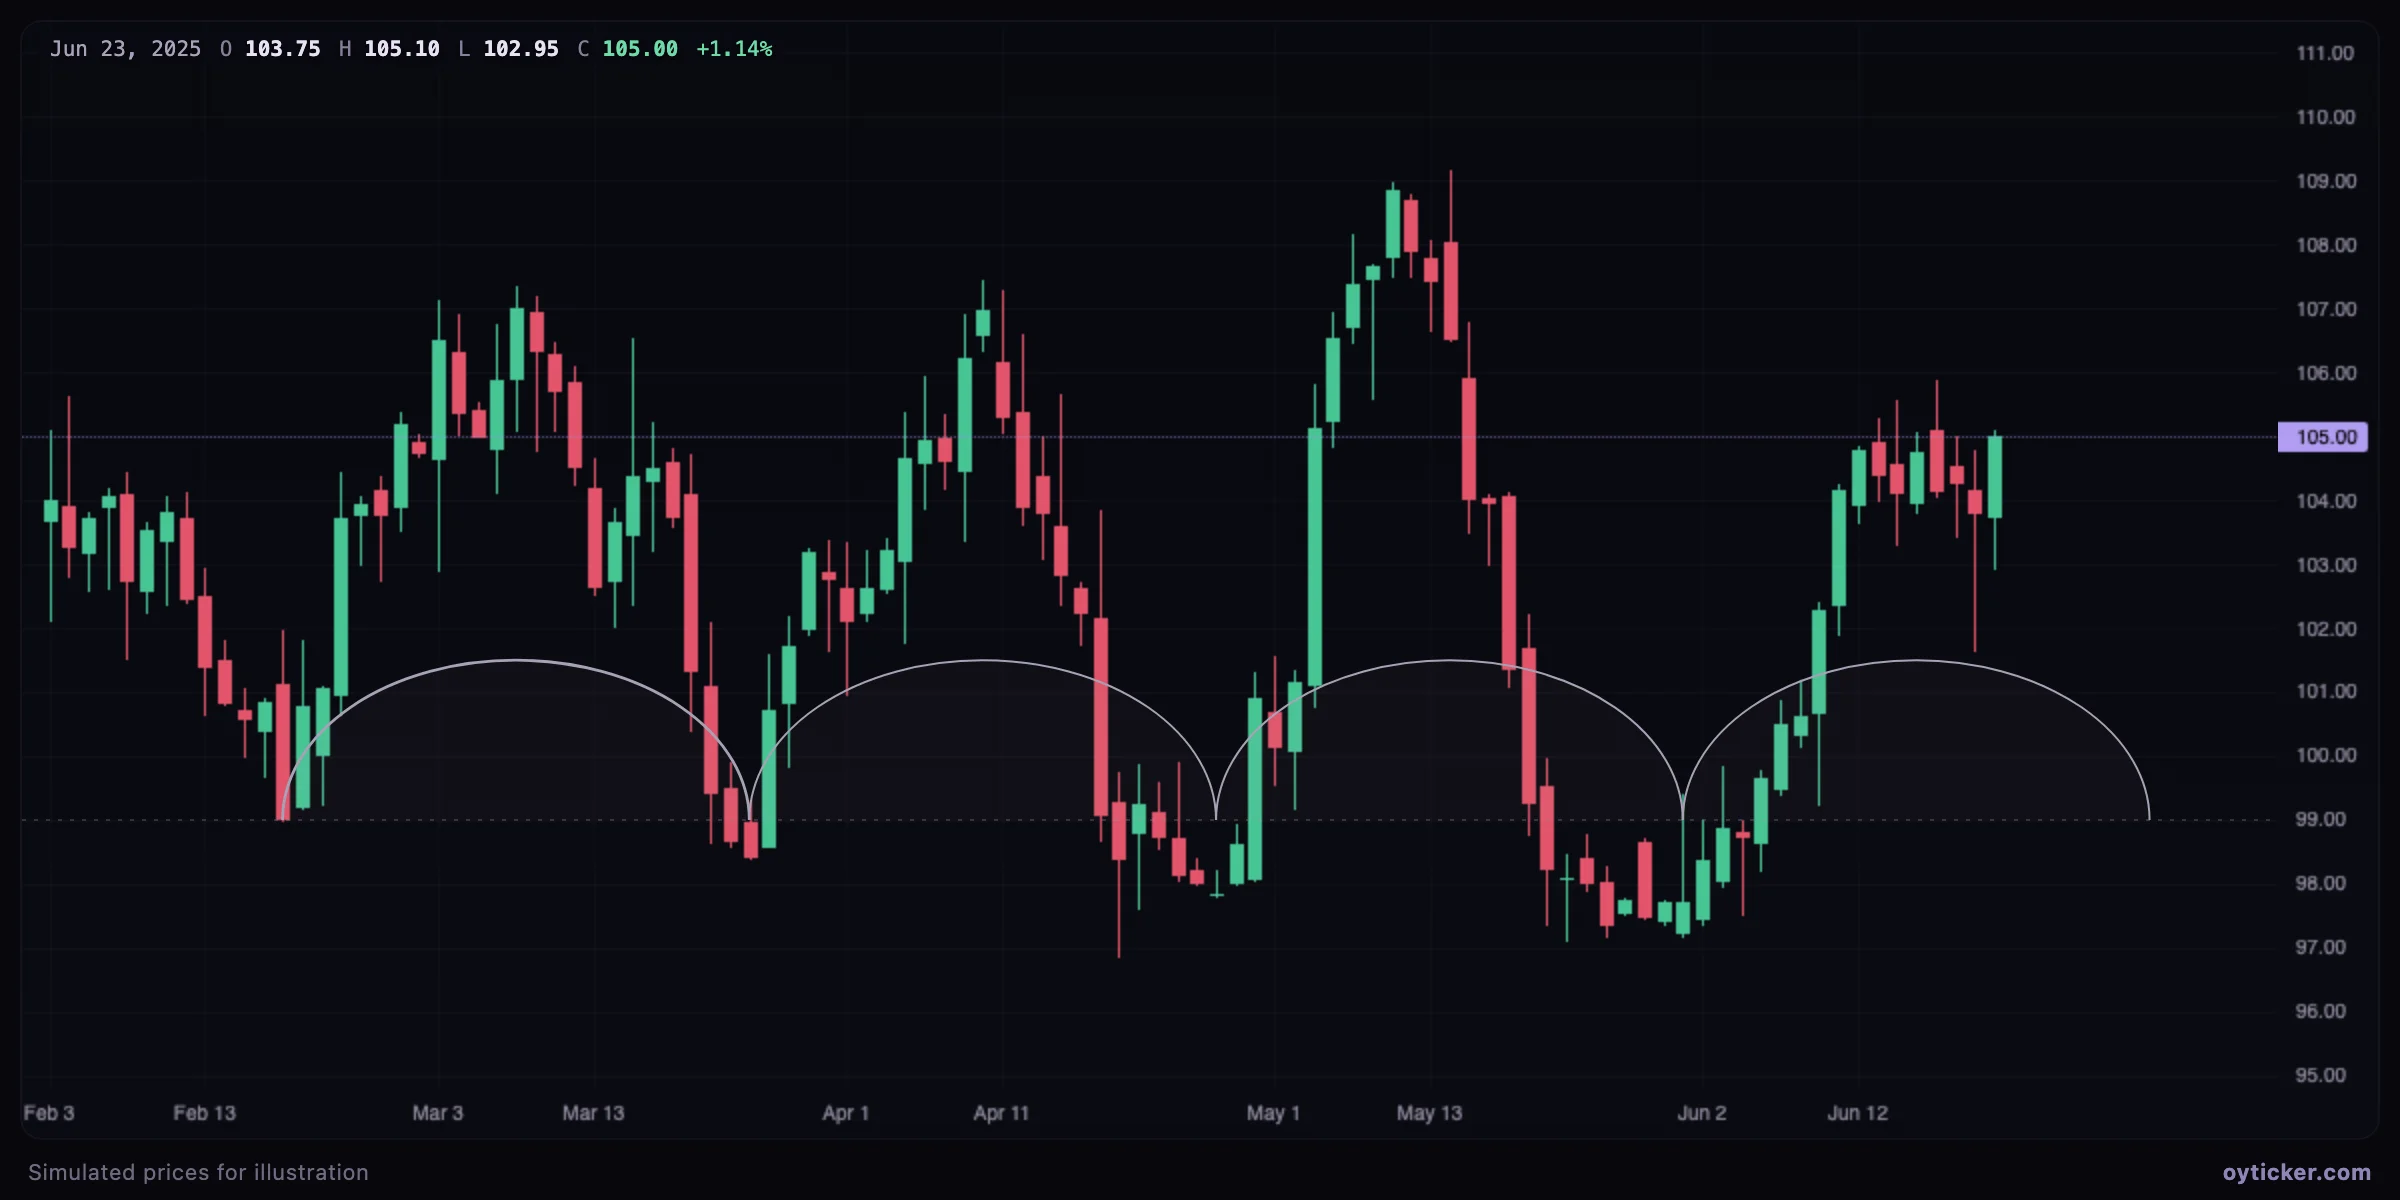
Time cycles draw a series of equal arcs, each spanning one cycle: the arcs' feet mark when cycle lows are due. It is the same idea as cyclic lines, drawn in the way cycle analysts (in the tradition of J. M. Hurst) usually sketch cycles.

What it's for
  • Visualize repeating cycles as arcs between cycle lows.
  • Judge the phase of the current cycle: early, middle or late.
Plus and Pro toolTry it in Analyze
Points
2, one cycle apart
Plan
Plus and Pro
Arc height
Set by the second point
Extends
Into the future

Reading the arcs

Repeating arcs whose feet fall on successive swing lows 24 bars apart
One arc spans the 24 bars between two lows; the repeated arcs' feet fall on the next lows. The height of the arcs is only visual: it comes from the second point.

Cycle analysts look for the phase of the cycle: early in the arc, the odds favor the advance; past the middle, the next low approaches. When price makes its high early in the cycle (left translation), the cycle is weak; a late high (right translation) shows strength.

Charts in this guide use simulated prices generated for illustration; levels and outcomes shown are examples, not observations of a real market. Educational content only, not investment advice.