Drawing tools · Cycles

Sine line

The sine line draws a sine wave through a peak and the following trough: the distance between them sets the half-period and the price difference the amplitude. It shows what a perfectly regular oscillation would look like, and where the next peaks and troughs would fall.

What it's for
  • Model a regular oscillation from a peak and the following trough.
  • Compare price with a perfect rhythm to see when that rhythm changes.
Plus and Pro toolTry it in Analyze
Points
2: a peak, then the next trough
Plan
Plus and Pro
Formula
mid + amplitude × cos(π (i − i₁) / half-period)
Extends
Across the whole chart

Fitting the wave

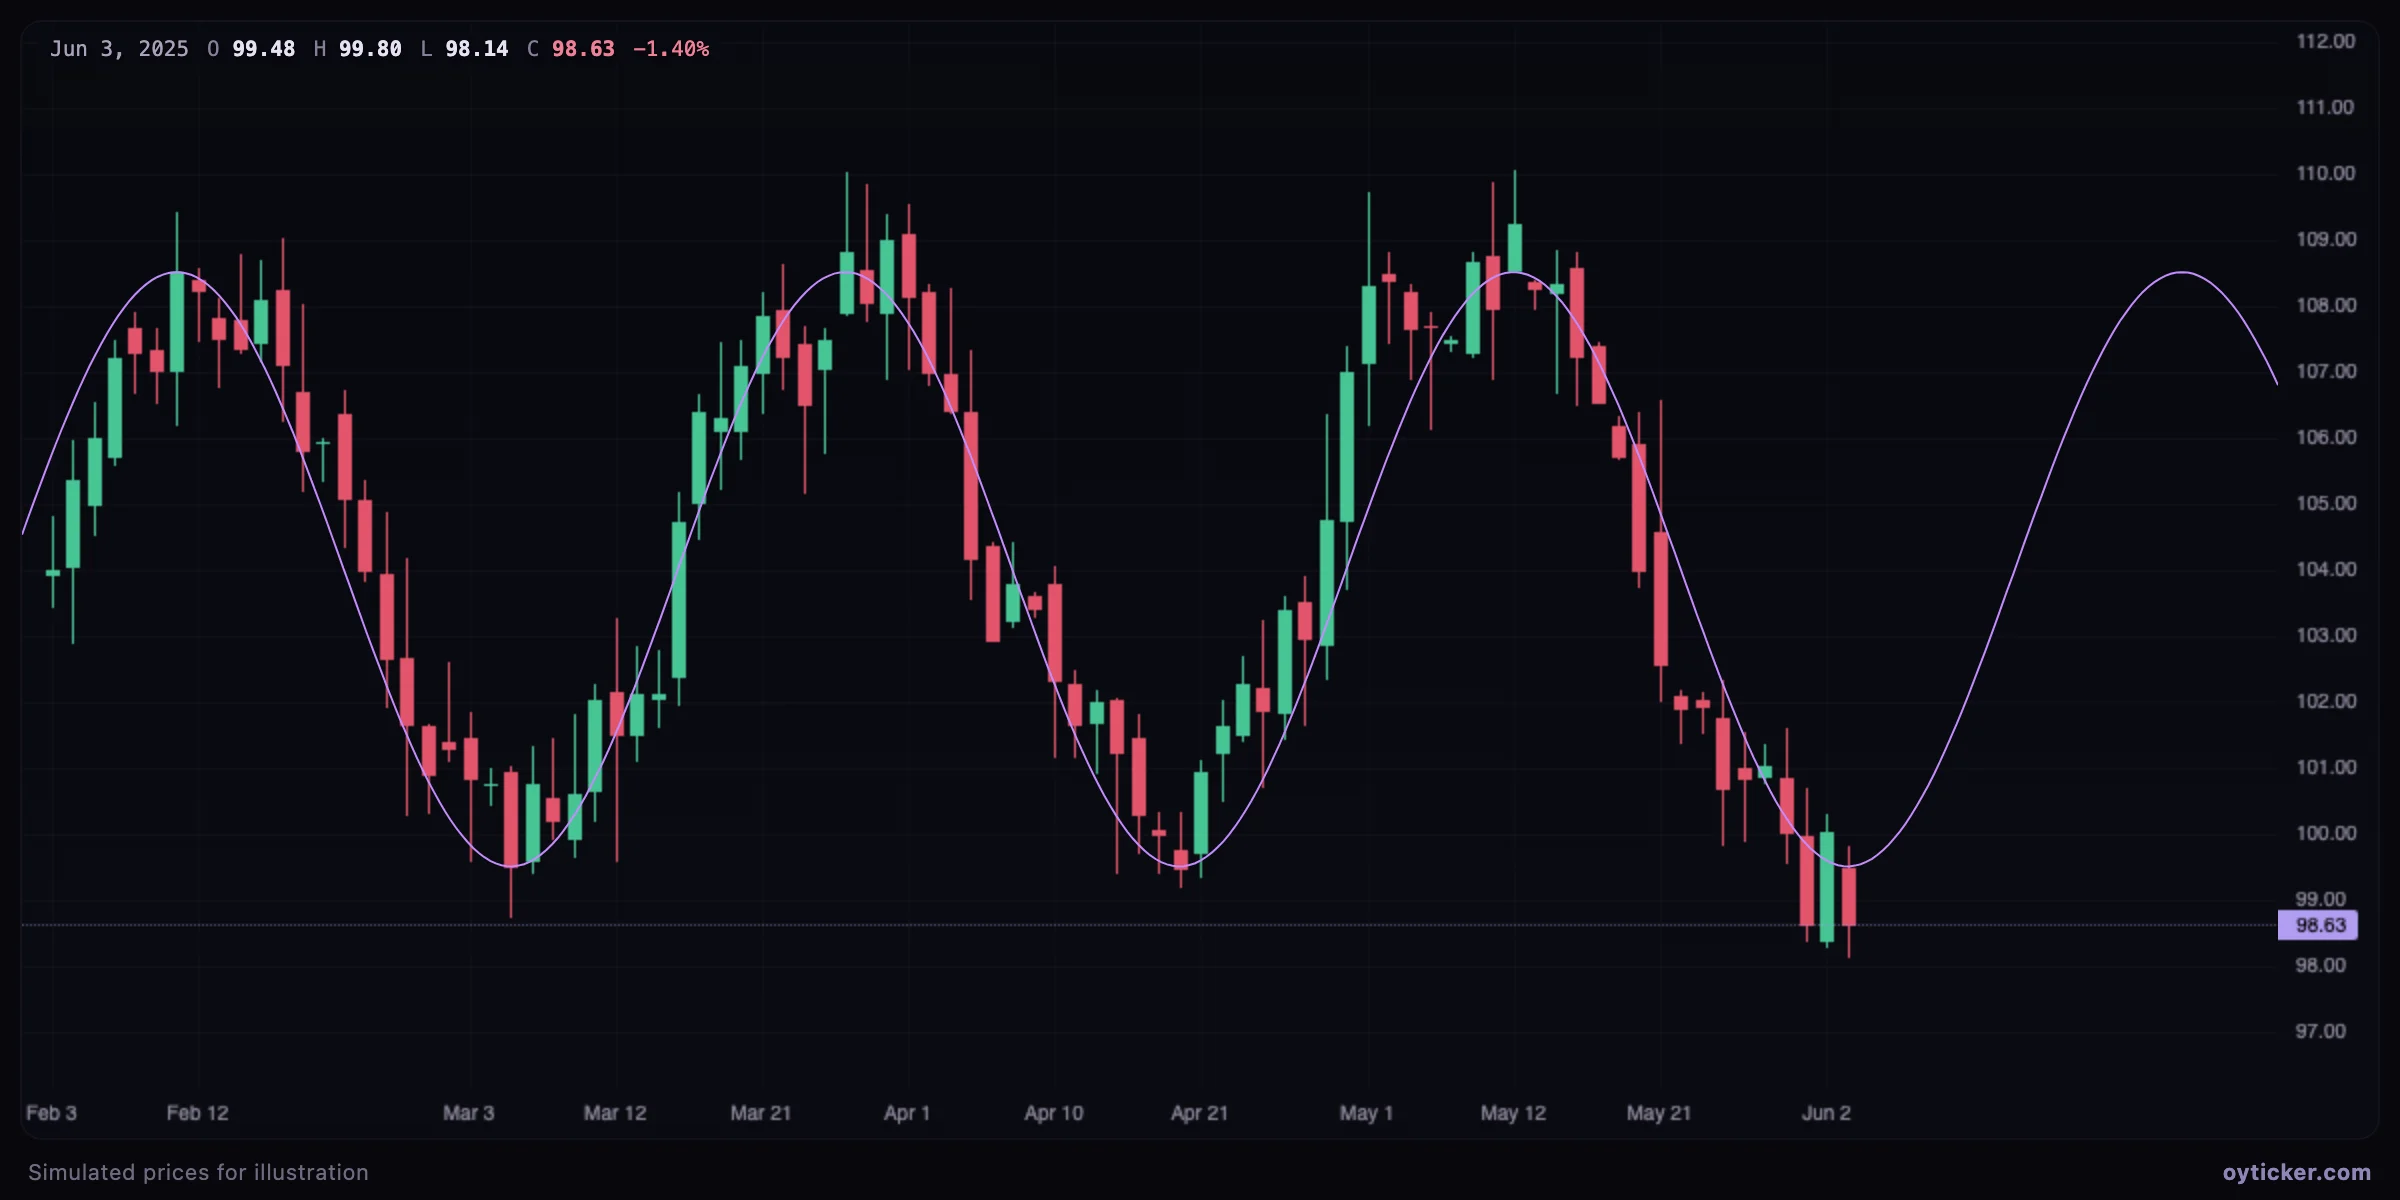
Sine wave fitted to an oscillating market, extending into the future
A peak and the next trough, 16 bars apart, define a 32-bar wave. The price oscillates along it, and the wave shows where the next peak would be due.

The wave is a model of a regular oscillation: it fits ranges and cyclical markets, and fails as soon as a trend dominates. Comparing price with the wave shows when the rhythm changes, which is often more useful than the wave's forecast itself.

Charts in this guide use simulated prices generated for illustration; levels and outcomes shown are examples, not observations of a real market. Educational content only, not investment advice.