Drawing tools · Projection

Date and price range

The date and price range tool combines both measurements: the change in price and percent, and the number of bars, duration and volume of the move.

What it's for
  • Measure a move in price and in time at once.
  • Get the figures needed to compare the speed of different moves.
Points
2
Plan
Every plan
Shows
Change, %, bars, duration, volume
Same figures as
Measure

Example: a decline in price and time
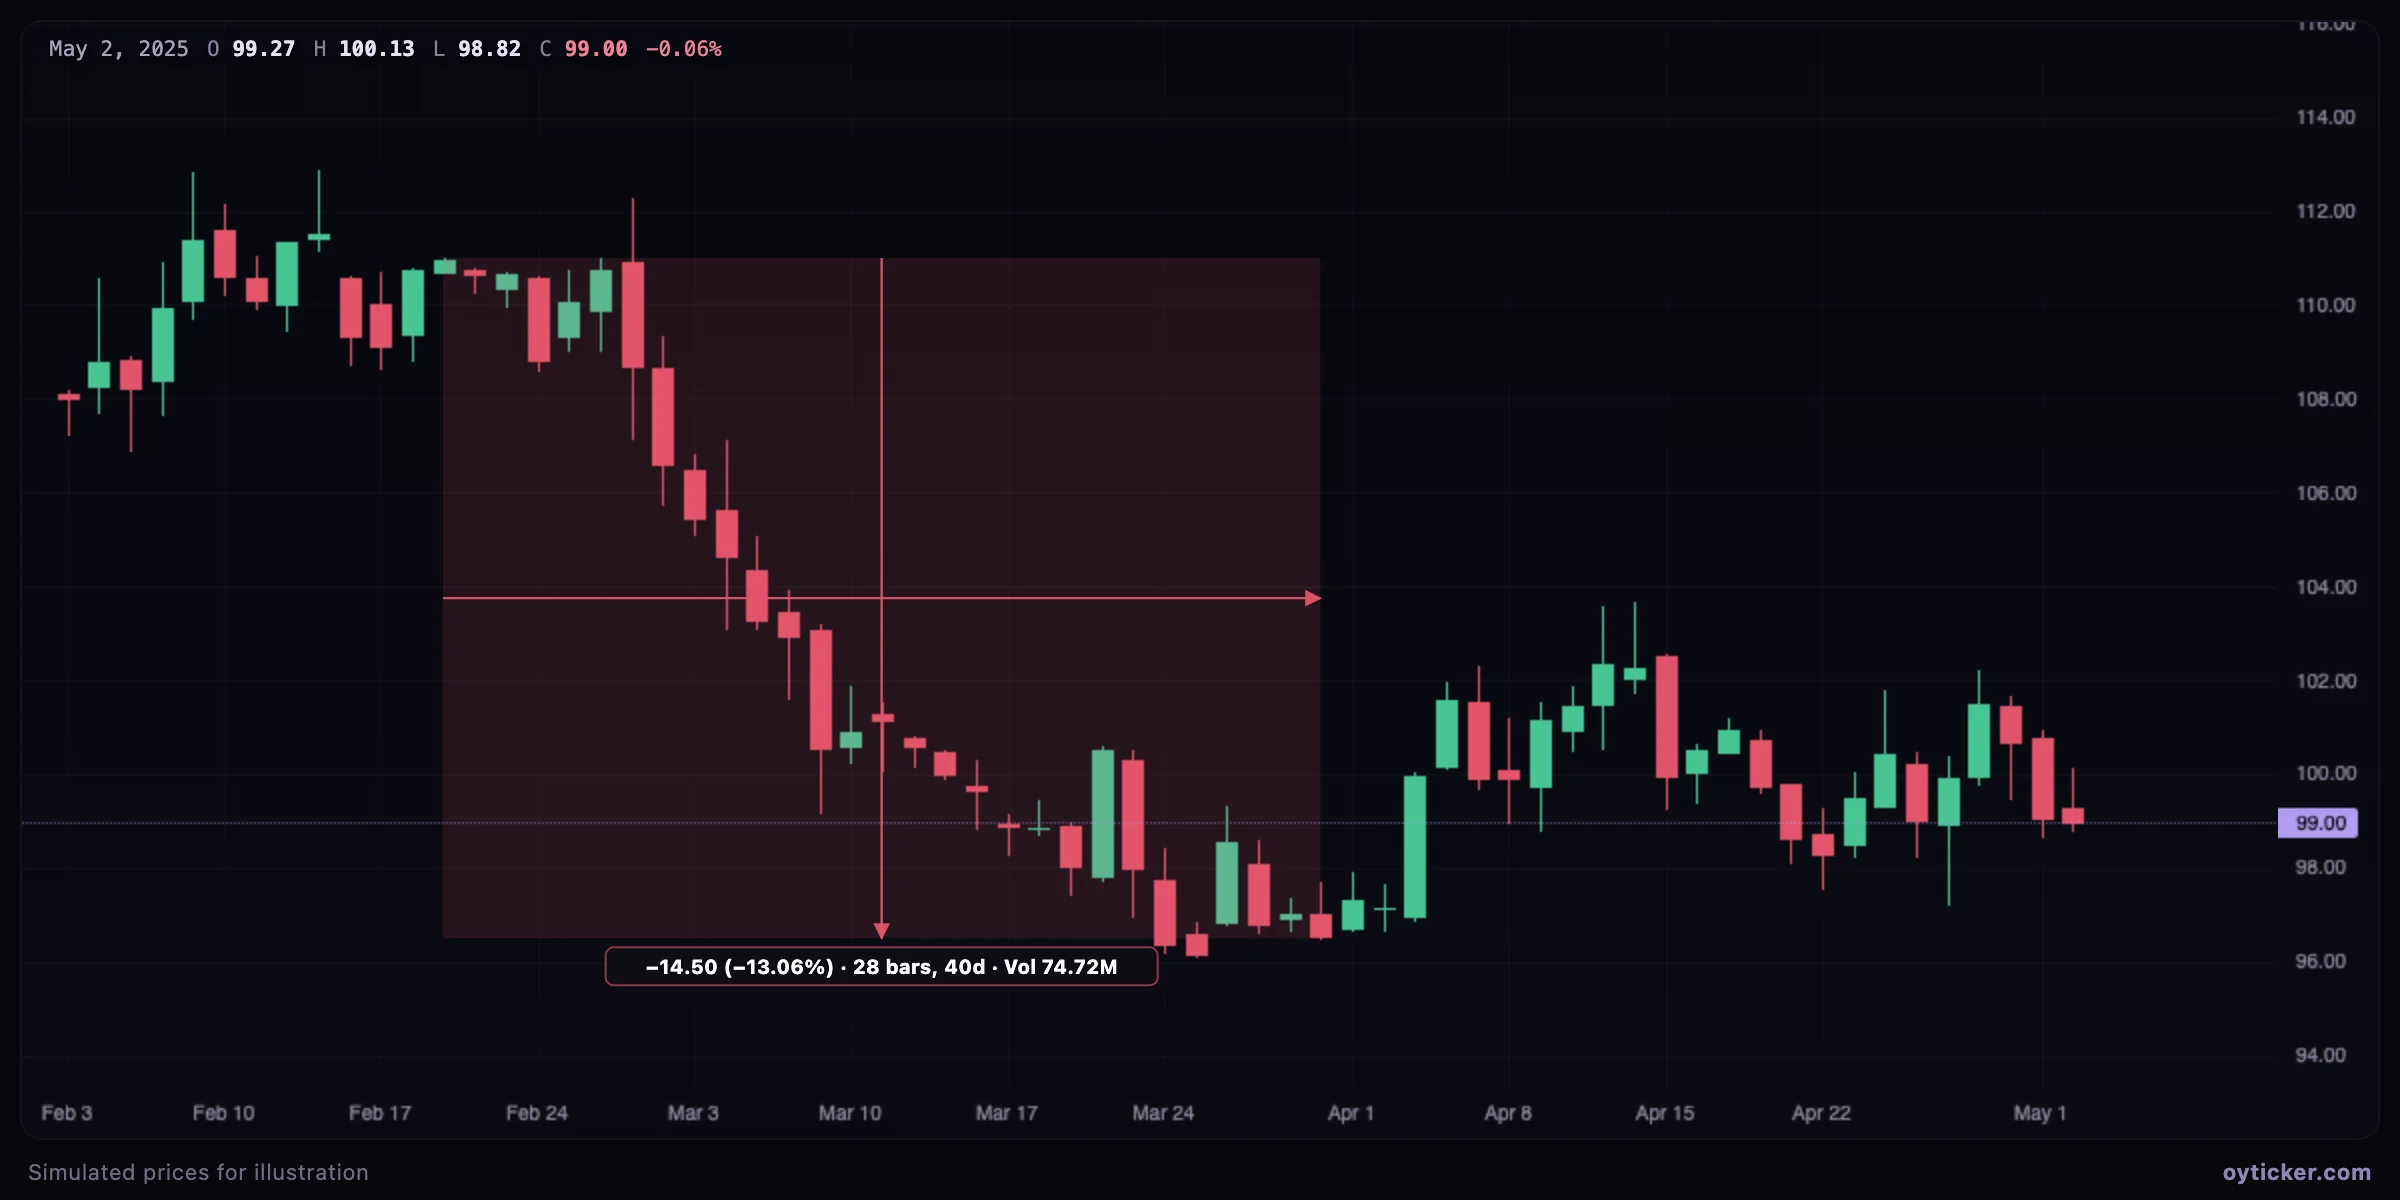
Date and price range from a swing high at 111 to a swing low at 96.50 showing −14.50, −13.06%, 28 bars and 40 days
From the high at 111 to the low at 96.50: −14.50 points (−13.06%) in 28 bars, 40 calendar days. The box is red because the move is down.

Speed is the ratio of the two: here about 0.52 points, or 0.47%, per bar. Comparing the speed of successive legs is a simple way to see acceleration or exhaustion.

Charts in this guide use simulated prices generated for illustration; levels and outcomes shown are examples, not observations of a real market. Educational content only, not investment advice.

Date and price range tool: measure a move in price and time at once | Oyticker