Drawing tools · Projection

Price range

The price range tool measures the vertical distance between two prices, in points and in percent of the first one. It is the quickest way to get the height of a range, a gap or a candle.

What it's for
  • Measure a price distance in points and percent: the height of a range, a gap or a candle.
  • Project a measured move from a breakout.
Points
2
Plan
Every plan
Shows
Price change and %
Typical use
Range height, measured moves

Example: the height of a range
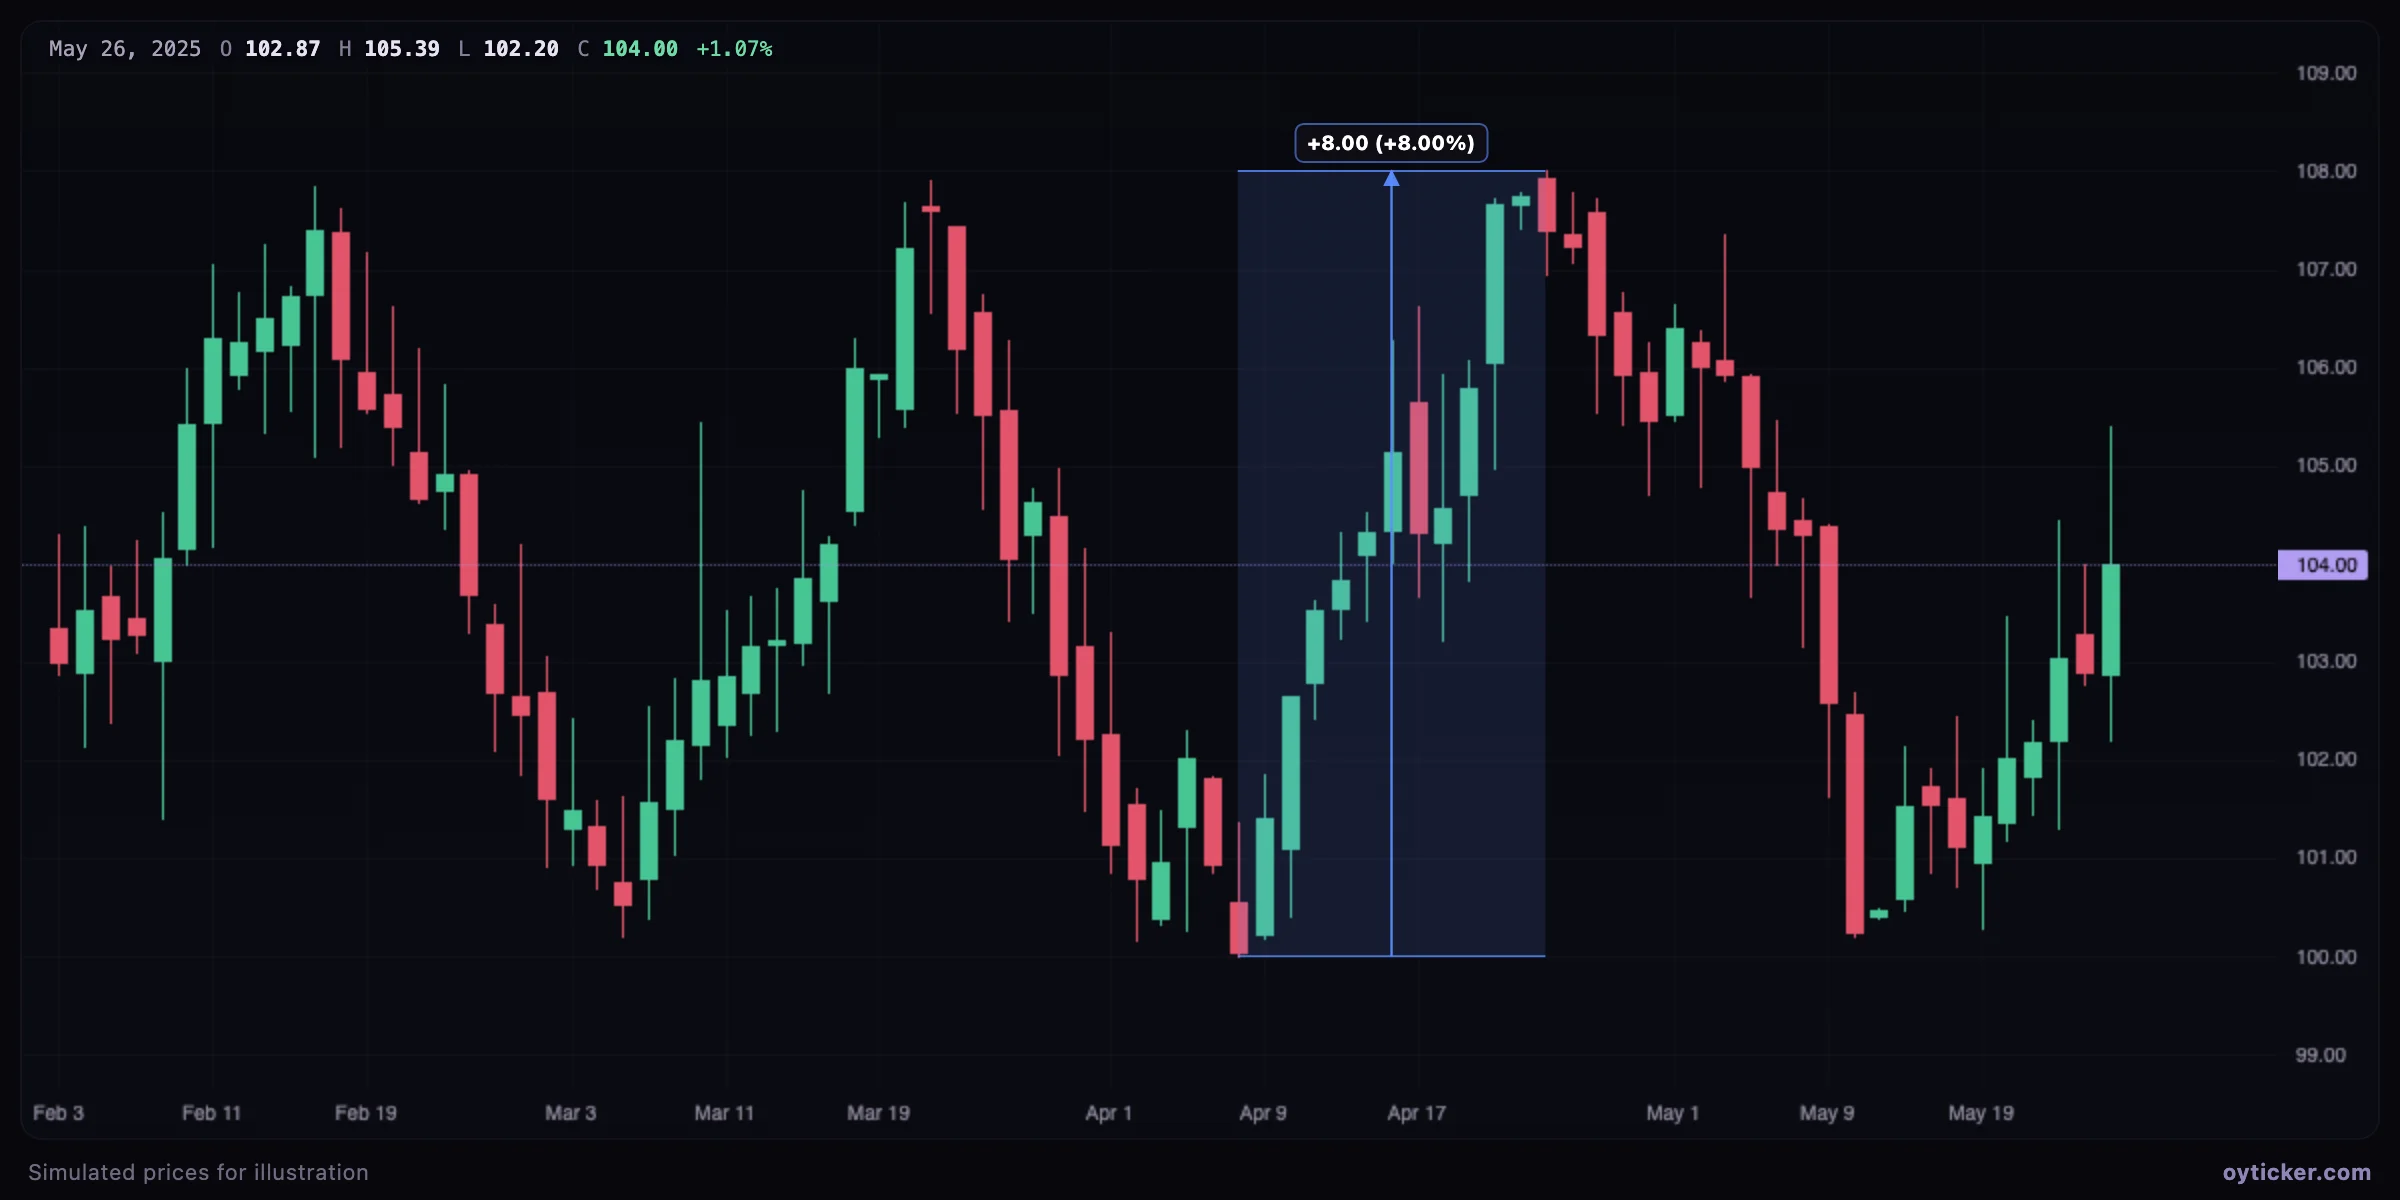
Price range tool from the bottom of a range at 100 to its top at 108 showing +8.00 and +8.00%
From support at 100 to resistance at 108: +8.00 points, +8.00%. A classic measured-move objective for a breakout of this range is the same height added to the breakout level, about 116.

Percentages are computed from the first point: from 100 to 108 is +8.00%, but from 108 back to 100 is −7.41%. Click the points in the direction of the move you are measuring.

Charts in this guide use simulated prices generated for illustration; levels and outcomes shown are examples, not observations of a real market. Educational content only, not investment advice.