
What it shows
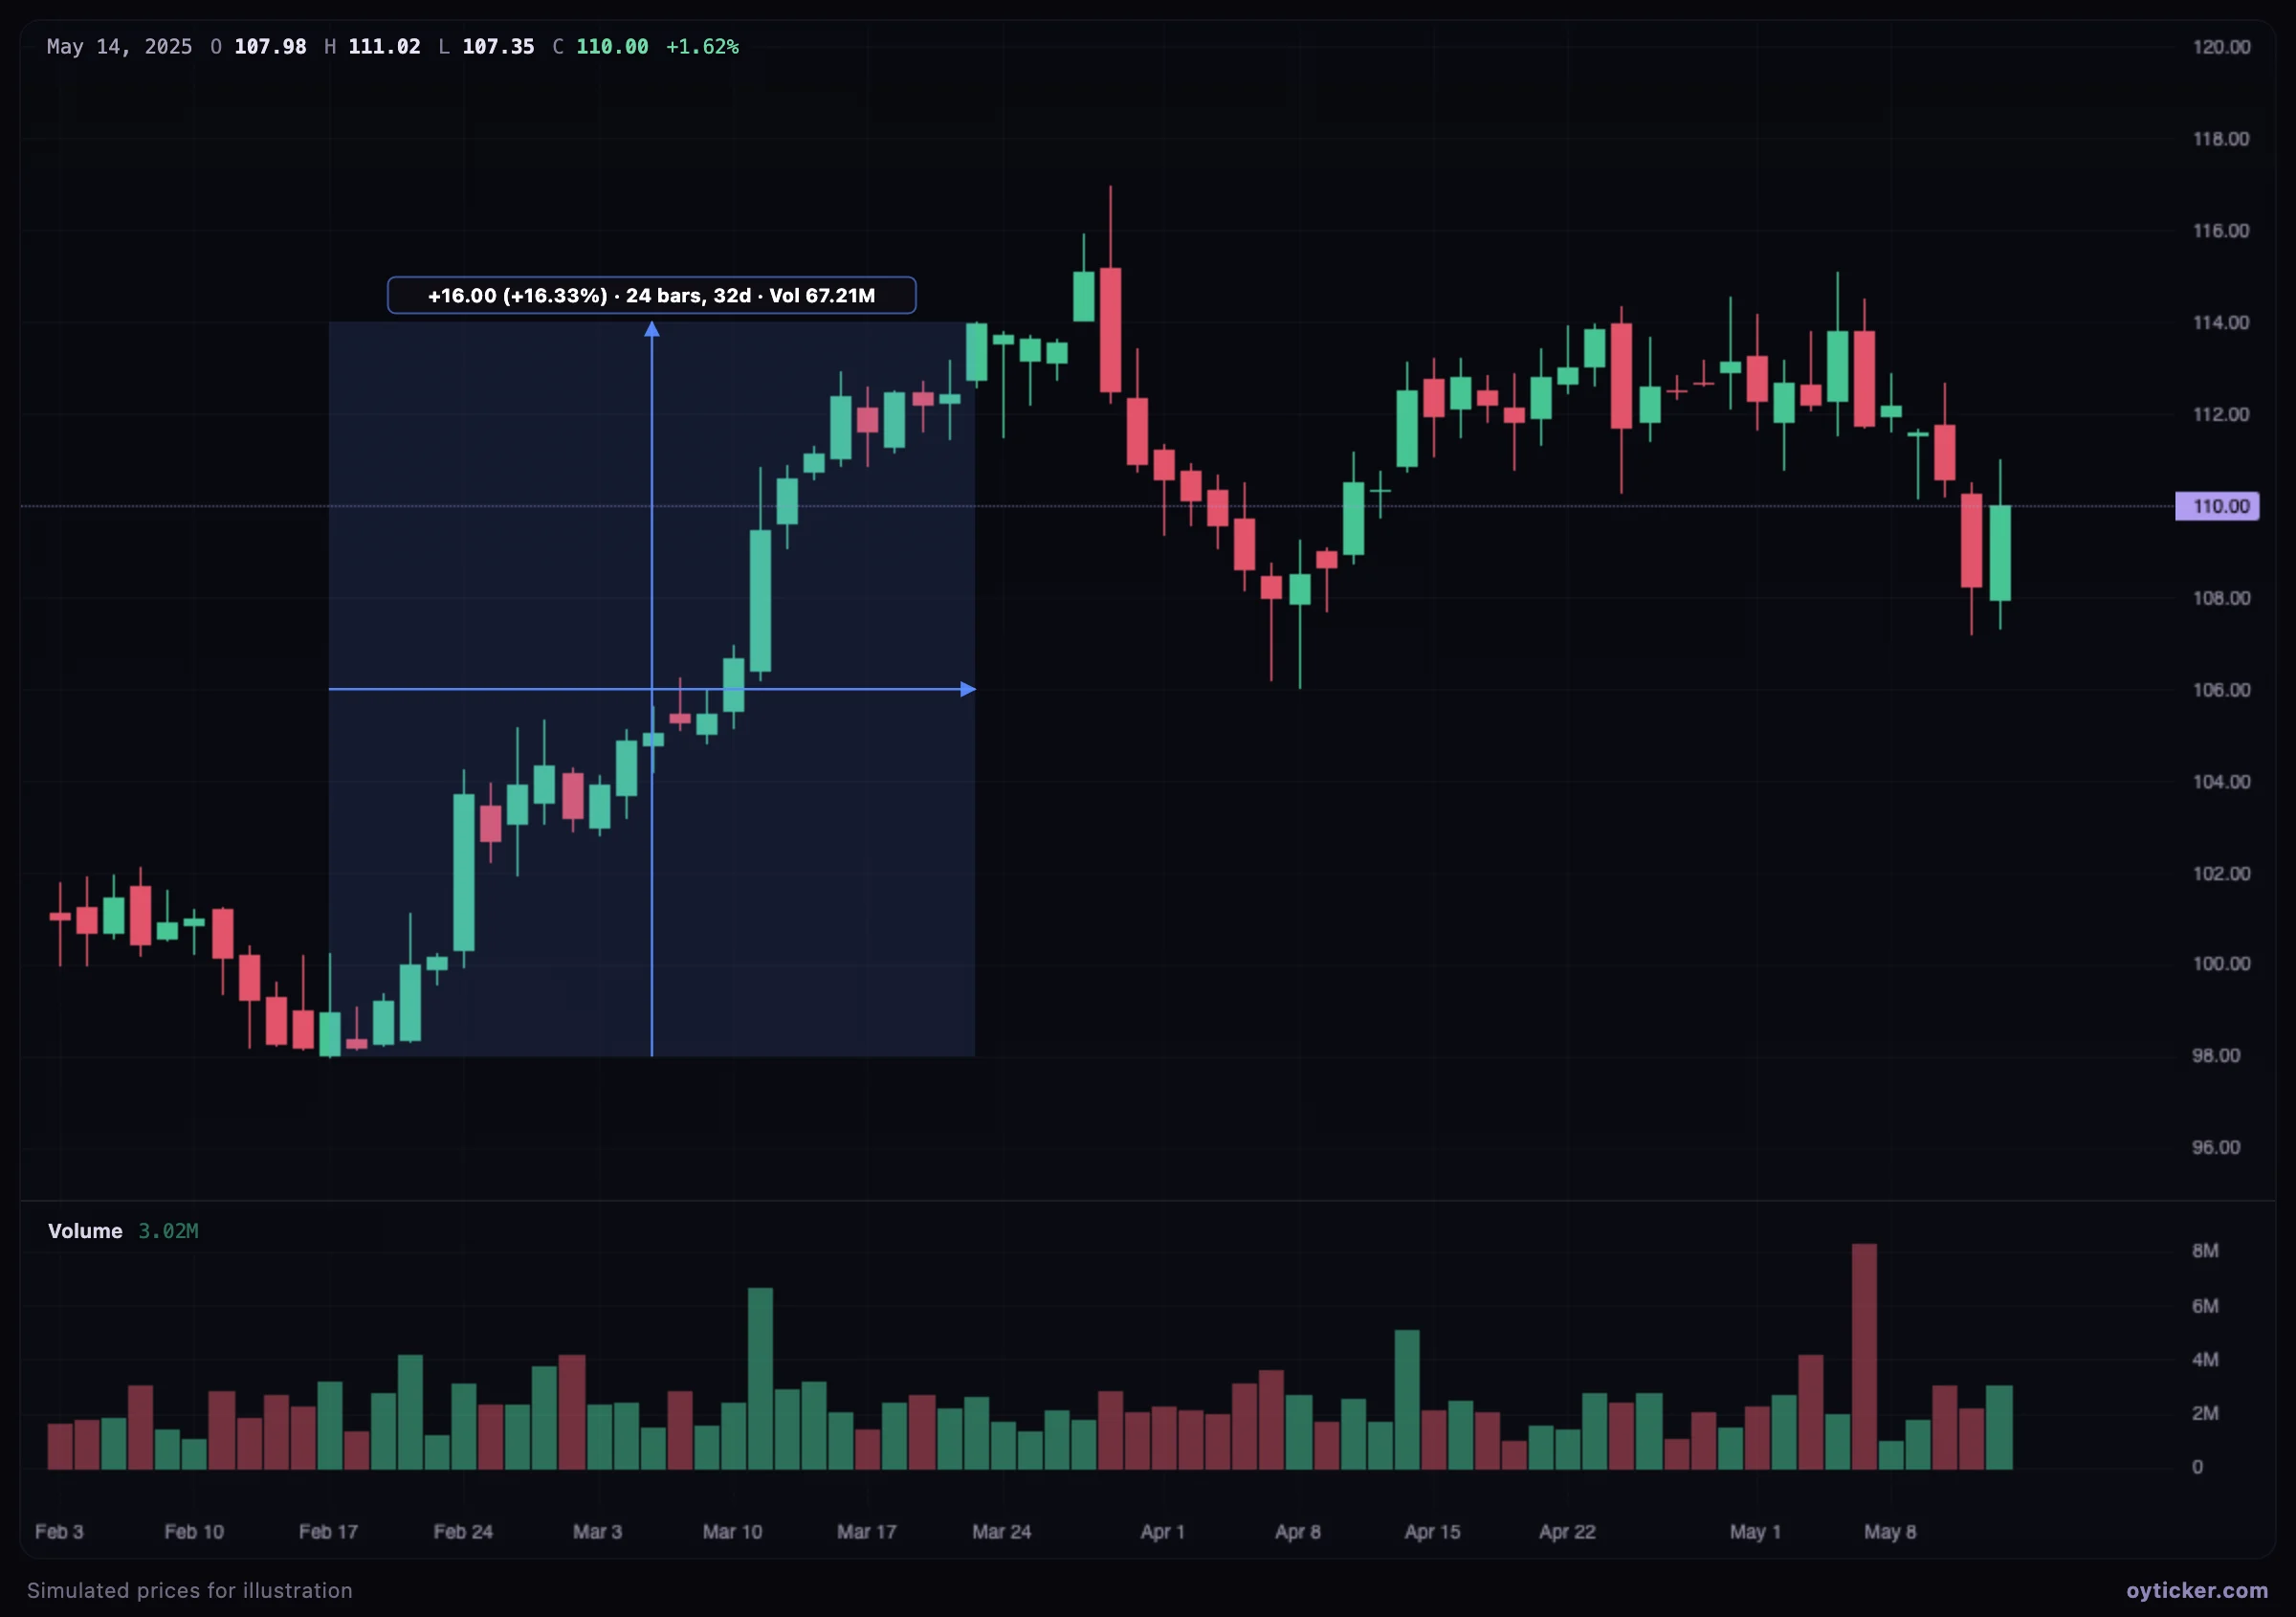
- Change and %:
end − start, and that change divided by the start price. - Bars: the number of candles between the two points, which is trading days on a daily chart. Duration: calendar time (days, months or years; hours and minutes on the 1D view).
- Volume: the sum of the volume of every bar from the first point to the second, both included.
How to use it
- Choose Projection & measure → Measure.
- Click the start, then the end (or press and drag). With the magnet, both points snap to candle prices.
Measure and date and price range show the same figures; use price range or date range to show only one dimension.
Charts in this guide use simulated prices generated for illustration; levels and outcomes shown are examples, not observations of a real market. Educational content only, not investment advice.