
Marking events
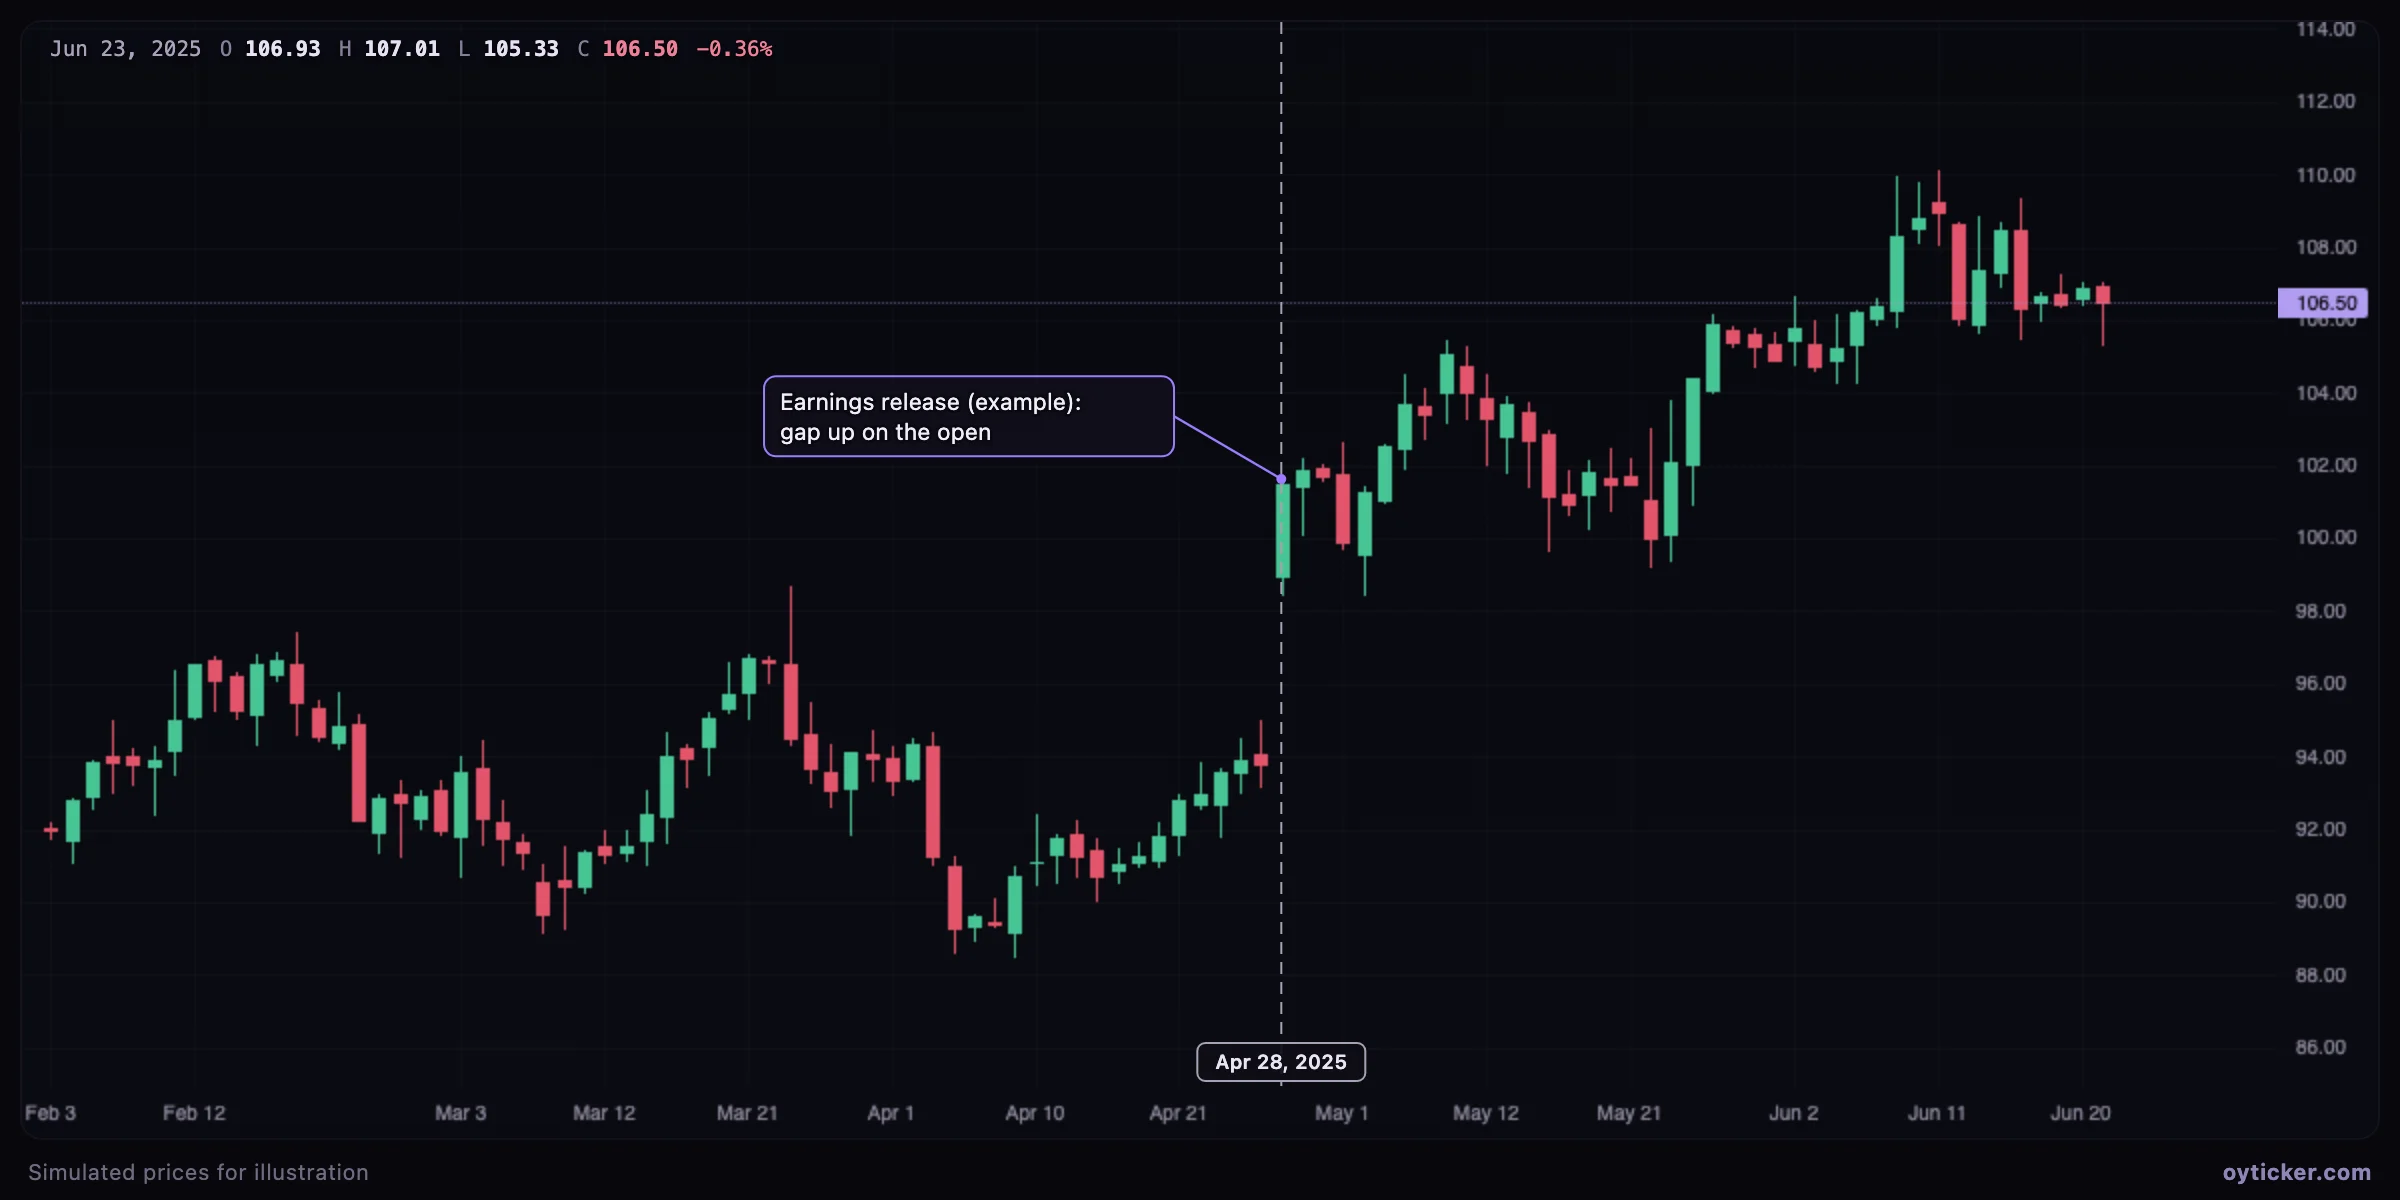
Price often changes character around scheduled events. Marking them makes the chart readable later: a gap, a volume spike or a trend change can be attributed to its cause, and the next occurrence of the same event can be prepared. The line can also be placed in the future (to the right of the last candle) to mark an upcoming release.
How to draw it
- Choose Lines → Vertical line and click the bar (or the future date) to mark.
- Use a dashed style and a neutral color for events so that they do not compete with price lines.
- On the 1D view, a vertical line marks a minute: useful for the open, the release time of a macro figure or the close of another market.
Limits
A vertical line has no price meaning by itself; it documents time. To measure what happened between two dates, use the date range or measure tool.
Charts in this guide use simulated prices generated for illustration; levels and outcomes shown are examples, not observations of a real market. Educational content only, not investment advice.