
Zigzags and flats
| Form | Structure | Shape |
|---|---|---|
| Zigzag | 5-3-5 | Sharp: B retraces a part of A (often 38.2–78.6%), C ends beyond A |
| Flat | 3-3-5 | Sideways: B returns to around the start of A, C ends near the end of A |
| Expanded flat | 3-3-5 | B exceeds the start of A, C goes clearly beyond A |
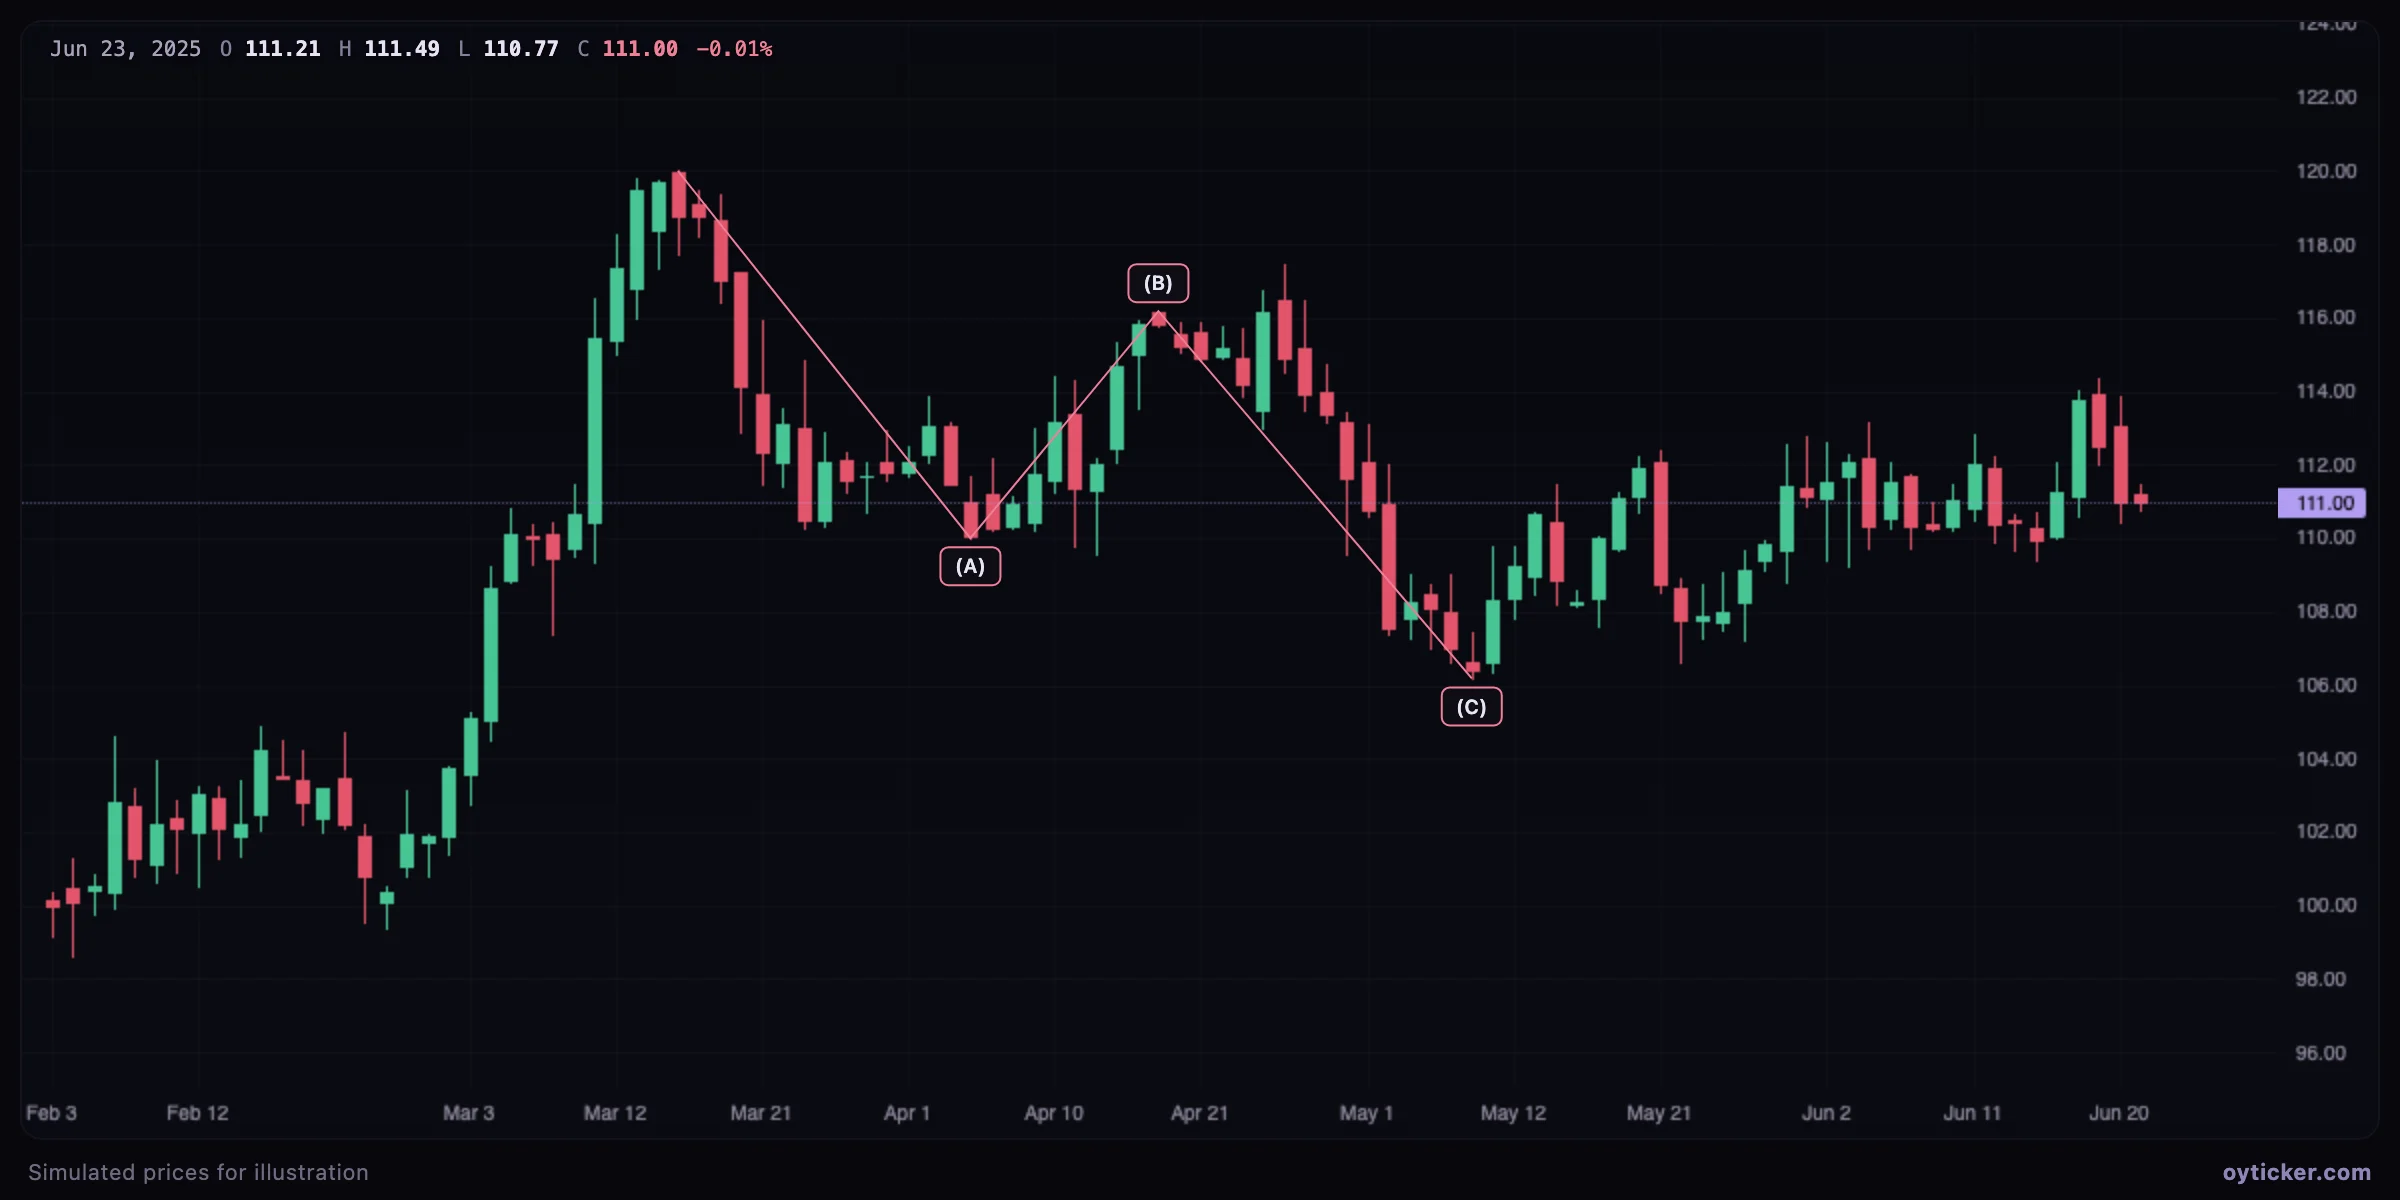
How to draw it
- Choose Patterns → Elliott correction (A-B-C).
- Click the end of the prior trend (the start of A), then the ends of A, B and C.
Use a trend-based Fibonacci extension on A and B to project where C would equal A (level 1.0) or be 1.618 times A.
Limits
Corrections are the hardest part of Elliott analysis: they can combine into double and triple threes, and they often look like the start of a new trend until they end. Define the level where the corrective count fails (for a zigzag in an uptrend, a decline far beyond C = 1.618 × A points to a trend change rather than a correction).
Charts in this guide use simulated prices generated for illustration; levels and outcomes shown are examples, not observations of a real market. Educational content only, not investment advice.