
Structure and ratios
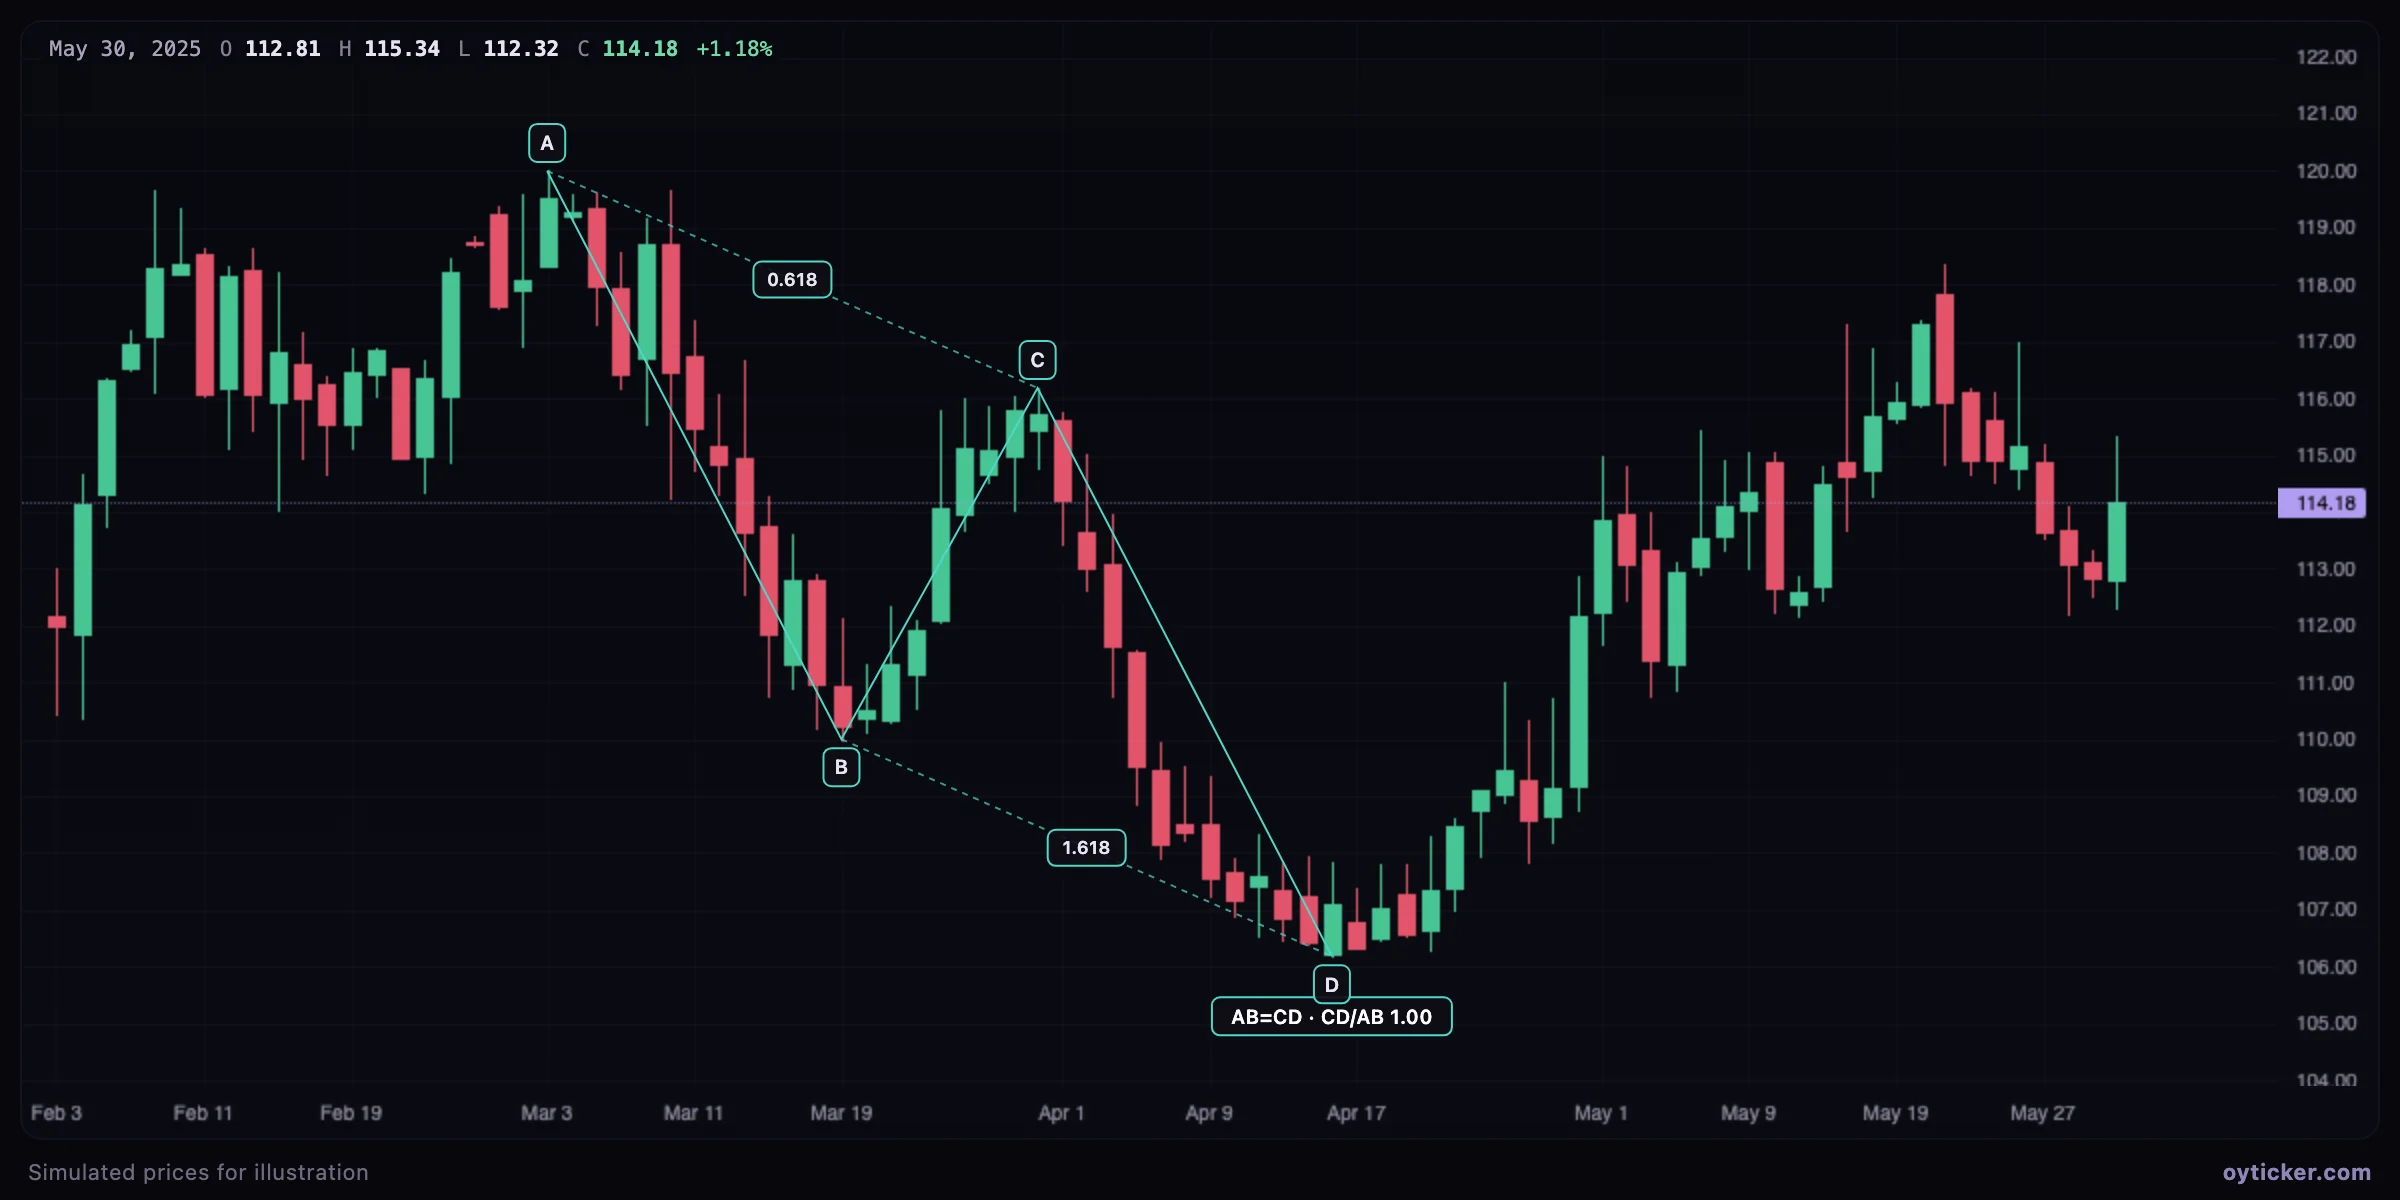
Oyticker labels the pattern AB=CD when the ratios are valid and CD is within 5% of AB, and ABCD when the ratios are valid but the legs are unequal. The two pills on the dashed lines show the BC retracement of AB and the CD extension of BC. The two are linked: with a 0.618 retracement, an equal CD leg is 1.618 times BC.
How to draw it
- Choose Patterns → AB=CD and click A, B, C, D on alternating swing points.
- Compare the time of the two legs with the date range tool: equal durations strengthen the pattern.
To anticipate D before it forms, draw a trend-based Fibonacci extension on A, B and C: level 1.0 is exactly where CD = AB.
Limits
Legs are often unequal in strong trends (CD = 1.272 or 1.618 × AB is common). D is a place to look for a reaction, not a signal by itself.
Charts in this guide use simulated prices generated for illustration; levels and outcomes shown are examples, not observations of a real market. Educational content only, not investment advice.