
Why extend a line into the past
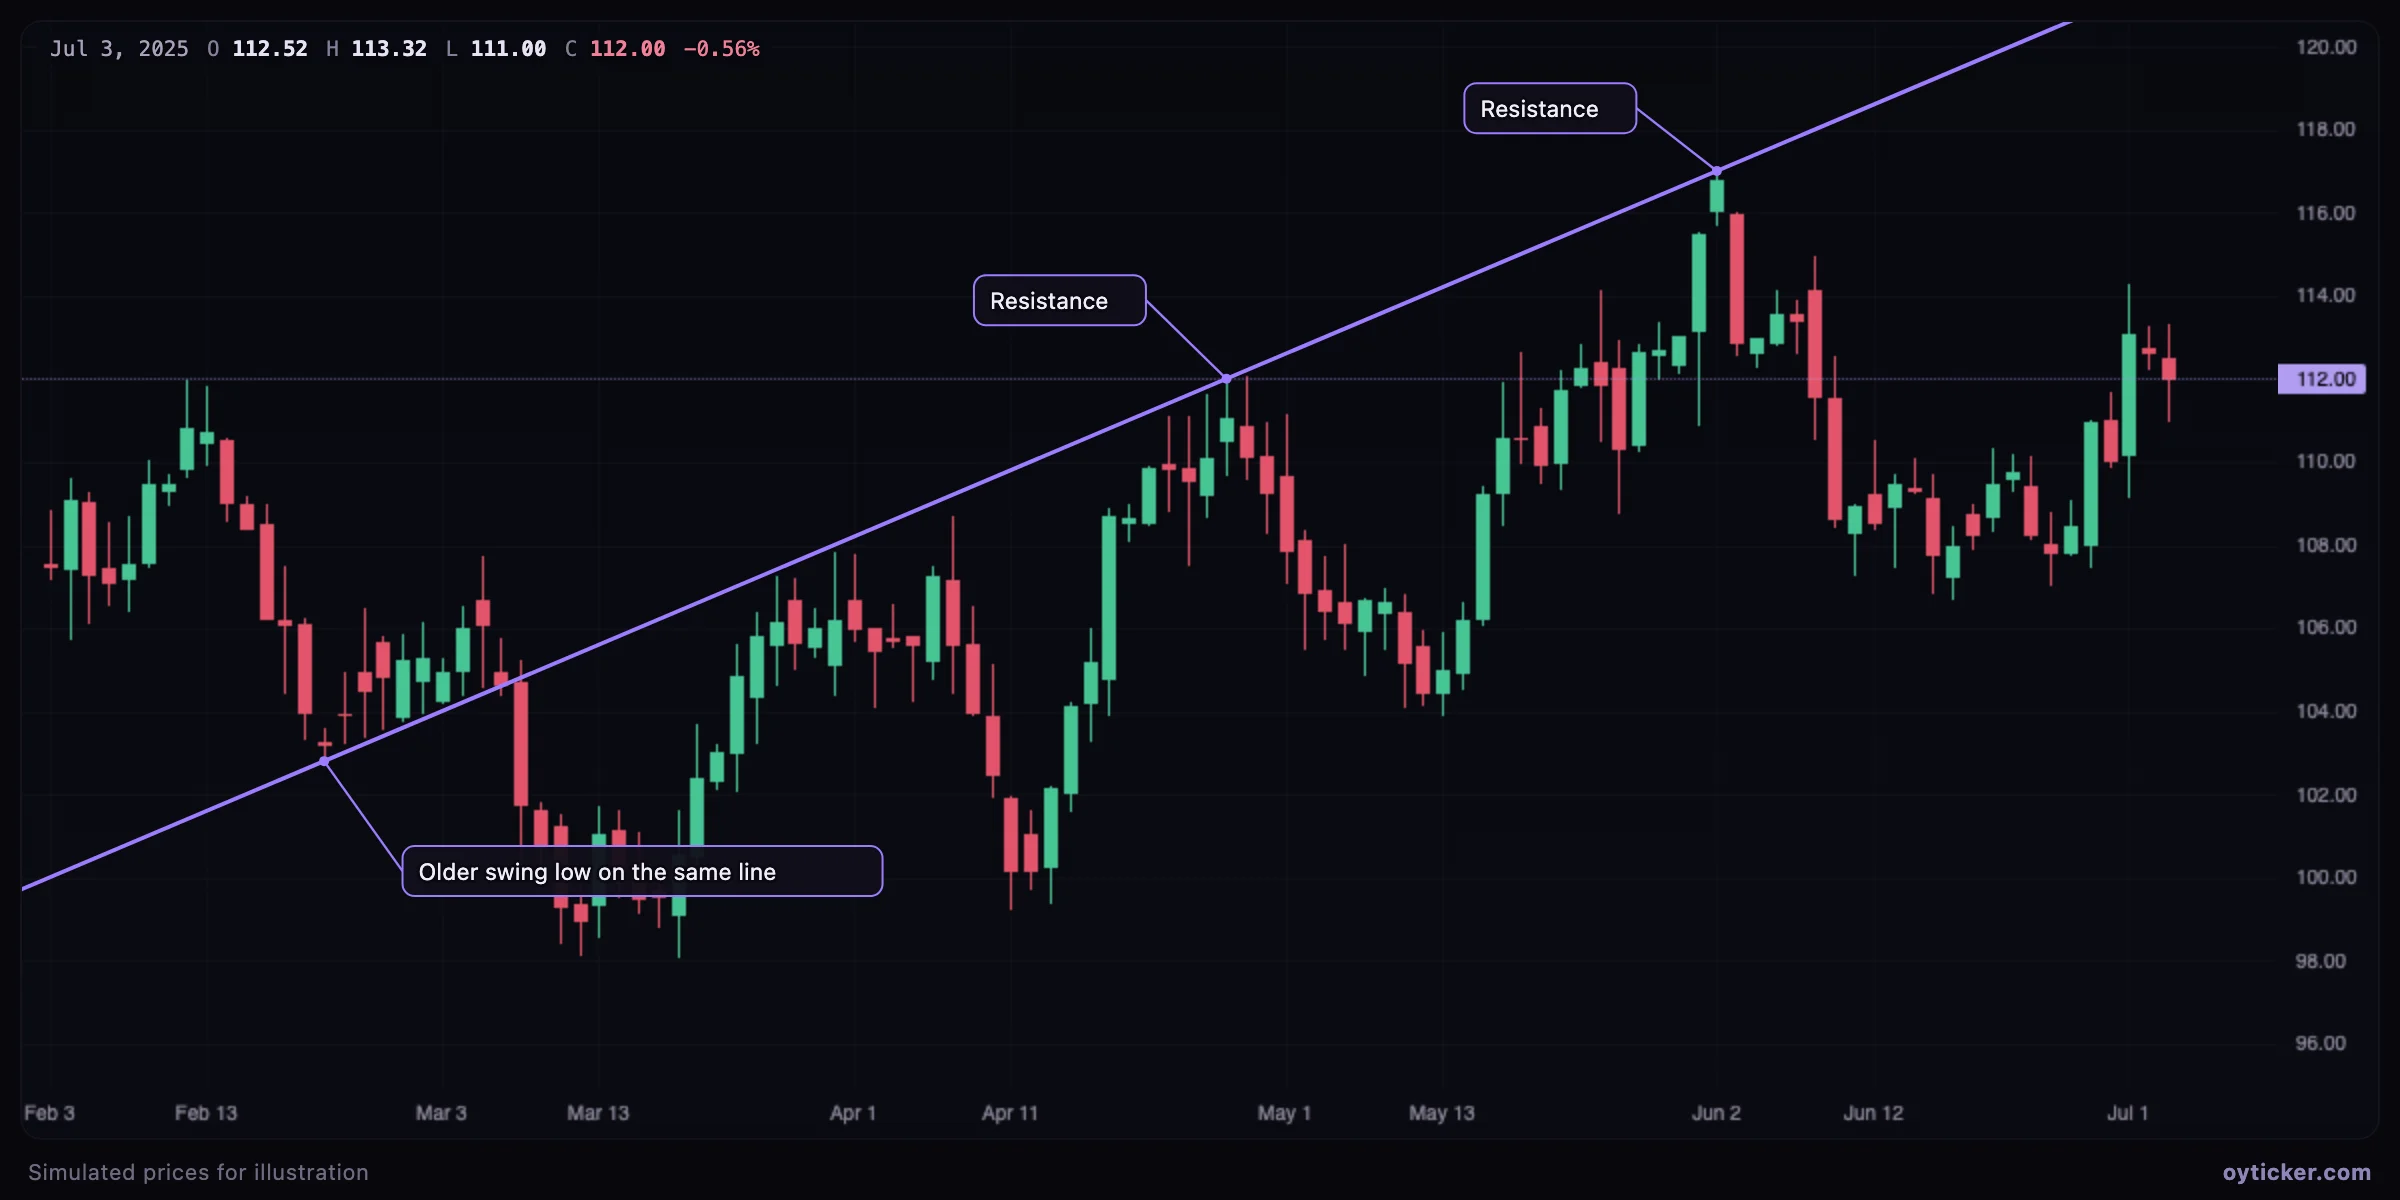
A line drawn on two recent swings is a fresh hypothesis. If the same line, extended to the left, also passes through an older pivot, three separate moments of the market agree on it, and the slope becomes much more credible. This is frequent with role reversals: a line that was support in the past becomes resistance once broken, and price keeps reacting to it months later.
How to draw it
- Choose Lines → Extended line.
- Click two swing points. The line extends to both edges of the chart.
- Scroll back in time to see whether older pivots sit on the line; drag the handles to test a slightly different slope if needed (with the magnet on, each point stays on a candle price).
Limits
- With enough candles, any line passes near some old pivot. An alignment matters when the older pivot is a clear, important swing, not a random candle.
- On long histories the linear price scale matters: the same percentage move takes more vertical space at higher prices, so a straight line on a linear scale is not a constant growth rate.
- When the past is irrelevant (a new trend after a long range), a ray is cleaner.
Charts in this guide use simulated prices generated for illustration; levels and outcomes shown are examples, not observations of a real market. Educational content only, not investment advice.