
When a ray is the right tool
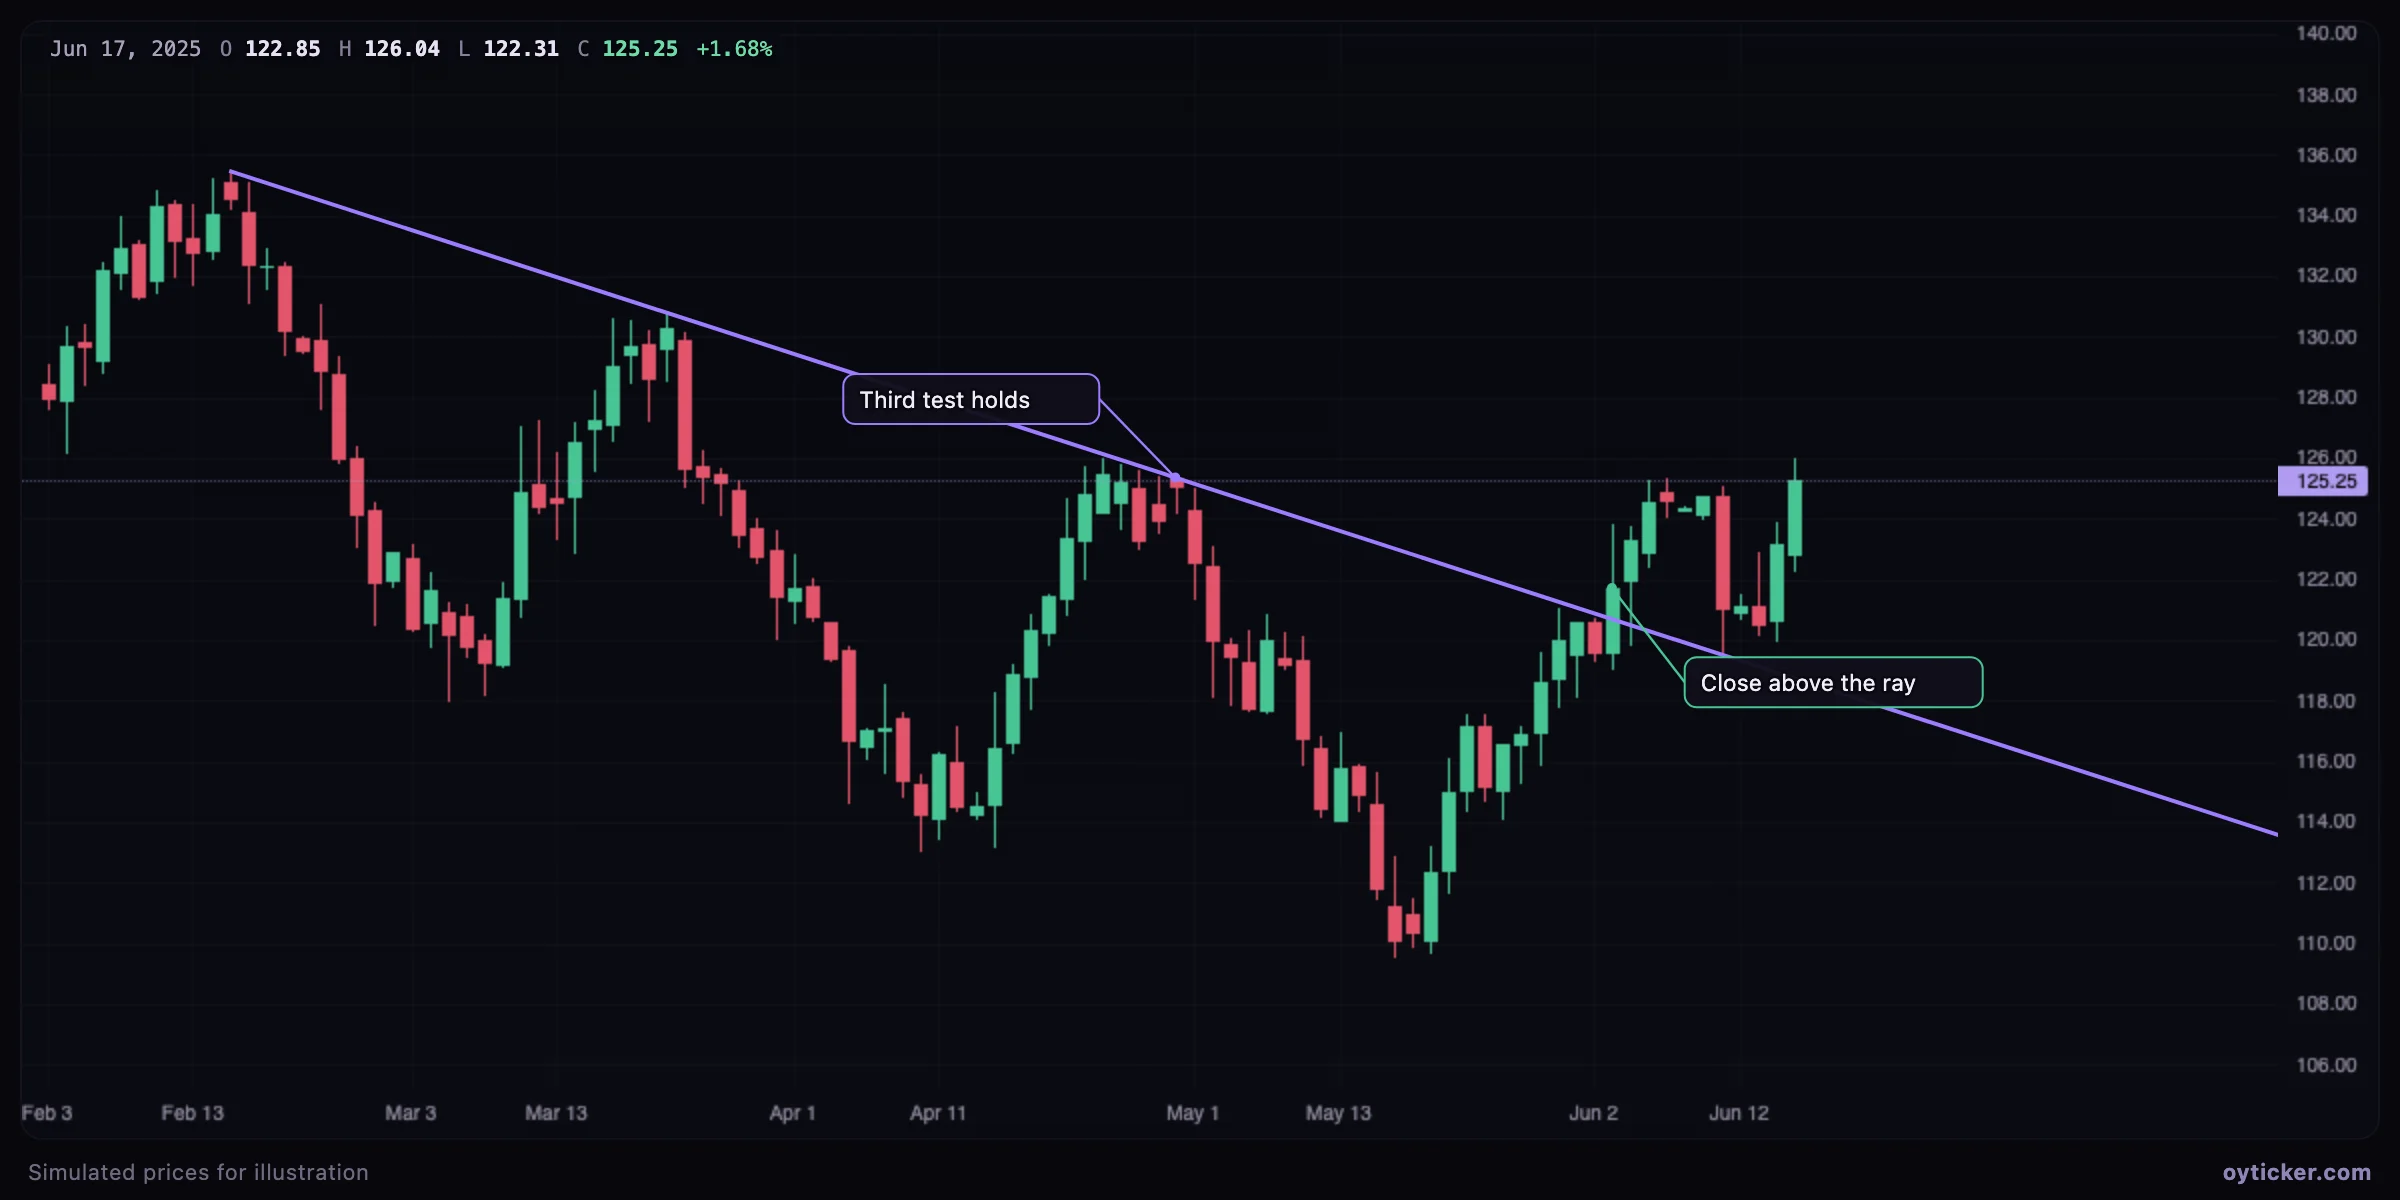
Use a ray when the question is “where will this line be next week?”. A trend line stops at its second point unless extended; an extended line also runs backwards through older prices that have nothing to do with the current trend. A ray starts at the first swing point that defines the trend and runs into the future, including the empty area to the right of the last candle.
How to draw it
- Choose Lines → Ray.
- Click the origin: the swing point where the trend starts (a top for a descending ray, a bottom for a rising one).
- Click a second swing point of the same trend. The ray passes through it and extends to the right edge of the chart, into the future.
- Drag either handle to refine it; the magnet snaps both points to candle prices.
How to read it
The ray is read like a trend line: reactions on it confirm the slope, a close beyond it breaks it, and the first return to it after a break is the retest. Because it extends into the future, it is also a planning tool: the level where an order or an alert would be placed changes every bar, by the ray's slope.
Limits
- Rays drawn from minor swing points break quickly and generate noise. Start them at a meaningful high or low of the timeframe.
- Far into the future, a ray describes the past slope, not a forecast. The further right you read it, the less it says.
- If you need the line in both directions (for example to check that it also aligns with older pivots), use an extended line.
Charts in this guide use simulated prices generated for illustration; levels and outcomes shown are examples, not observations of a real market. Educational content only, not investment advice.