
What a channel shows
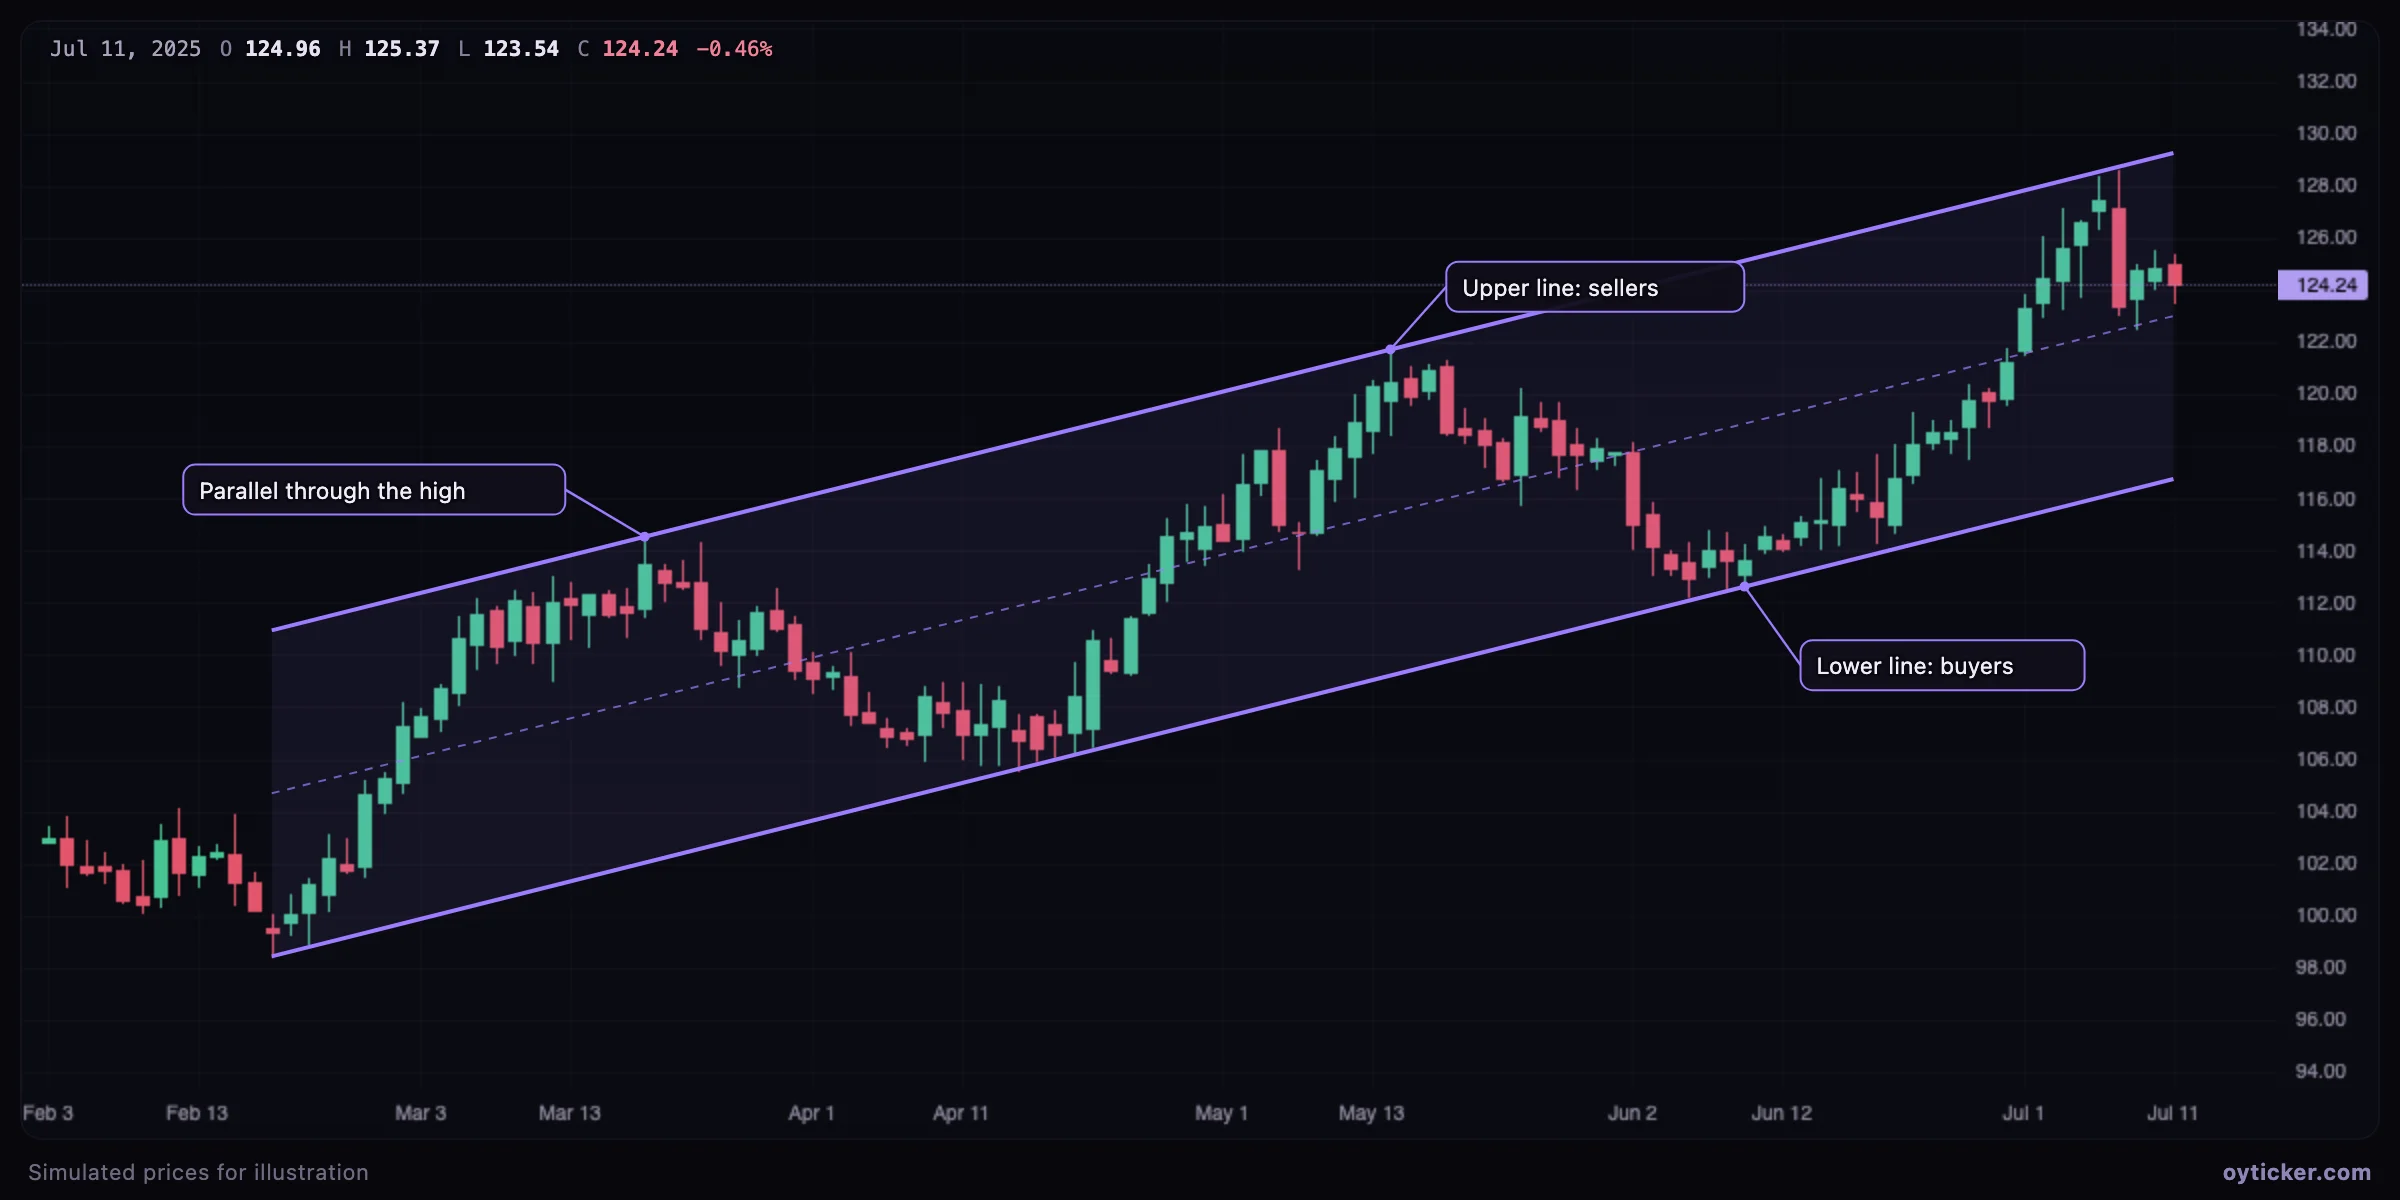
Trends rarely move in a straight line: they alternate impulses and pullbacks of similar amplitude. When the swing highs and lows line up on two parallel lines, the channel describes both the direction (the slope) and the normal amplitude (the width). Price near the lower line of a rising channel is “cheap” relative to the trend; near the upper line it is extended.
How to draw it in Oyticker
- Choose Channels & pitchforks → Parallel channel.
- Click two swing lows of an uptrend (or two swing highs of a downtrend): this is the base line. The second point can be placed further right on the same slope to make the channel longer.
- Click a swing high (or low) on the other side: the parallel line passes through it, and the midline is drawn halfway.
- Drag the handles to adjust. Moving the third point changes only the width; moving the first two changes the slope.
Case study: a rally that stalls at the midline
In a healthy channel each advance reaches, or nearly reaches, the opposite line. When a rally stops at the midline instead, buyers are losing strength: the next test of the lower line is more likely to fail. This is one of the most useful readings of a channel, because it warns before the break.
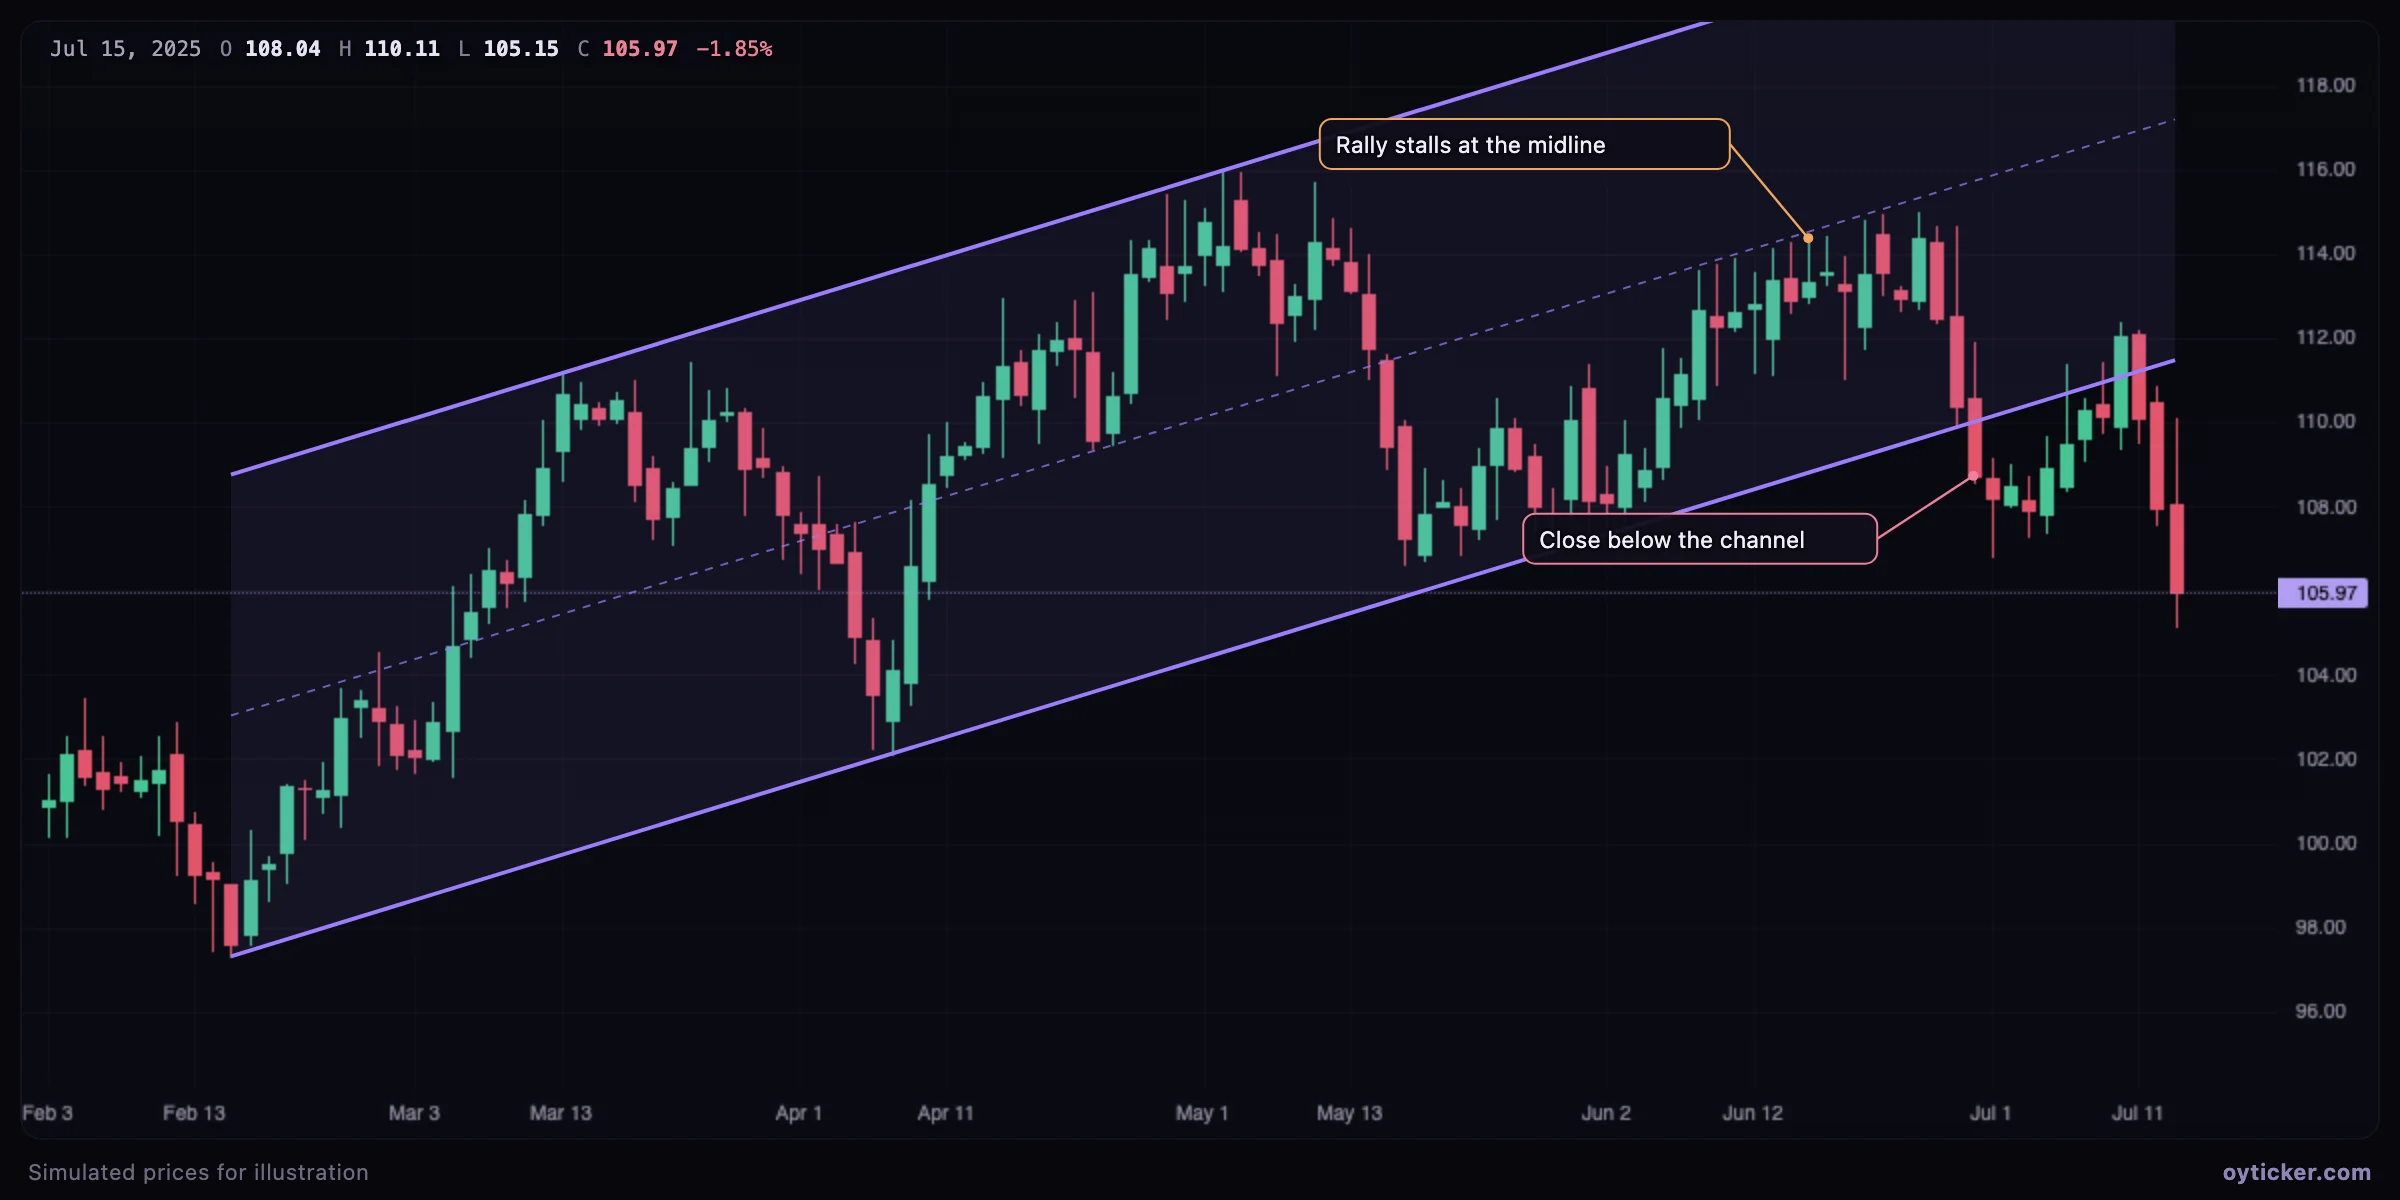
- A close outside the channel, not an intraday wick, marks the break.
- After a break, the former lower line often acts as resistance on a retest, as with a trend line.
- An advance that overshoots the upper line in a rising channel can be exhaustion (a blow-off) rather than strength, especially if it quickly falls back inside.
Limits
- A channel assumes a constant slope and width; real trends accelerate and slow down. Redraw when the structure clearly changes rather than stretching the old channel.
- The parallel line is a projection from a single point: give it less weight than the base until it has been touched again.
- For a channel computed objectively from all closes instead of chosen swing points, use the regression channel.
Charts in this guide use simulated prices generated for illustration; levels and outcomes shown are examples, not observations of a real market. Educational content only, not investment advice.