
What the levels mean
In Oyticker, as on most platforms, level 0 is at the end of the swing and 1 at its start: a level reads “how much of the move has been given back”. The price at level k is end − (end − start) × k. A 38.2% retracement of an advance from 100 to 120 is at 112.36; the 61.8% retracement at 107.64.
| Ratio | Where it comes from |
|---|---|
| 0.236 | 1/φ³ ≈ 0.236 |
| 0.382 | 1/φ² = 1 − 0.618 |
| 0.5 | Not a Fibonacci ratio: the “half-back” of Dow theory, kept because it is widely watched |
| 0.618 | 1/φ, the golden ratio's inverse (φ = (1 + √5)/2 ≈ 1.618) |
| 0.786 | √0.618 ≈ 0.786 |
| 1.272 | √1.618 ≈ 1.272 |
| 1.618 · 2.618 · 4.236 | φ, φ² and φ³ |
There is no physical reason for markets to respect these ratios. They matter because enough participants watch and trade them, and because they divide a swing into shallow (23.6–38.2%), normal (50–61.8%) and deep (78.6%) pullbacks, which is useful in itself.
How to draw it in Oyticker
- Choose Fibonacci → Fib retracement.
- Click the start of the swing (the low of an advance, or the high of a decline), then its end. Press and drag works too.
- Keep the magnet on so both points sit exactly on the swing's extreme wicks.
- Tick Extend right so the levels continue under the pullback that follows the swing; tick 1.618–4.236 to add extension levels beyond the start.
How to read it
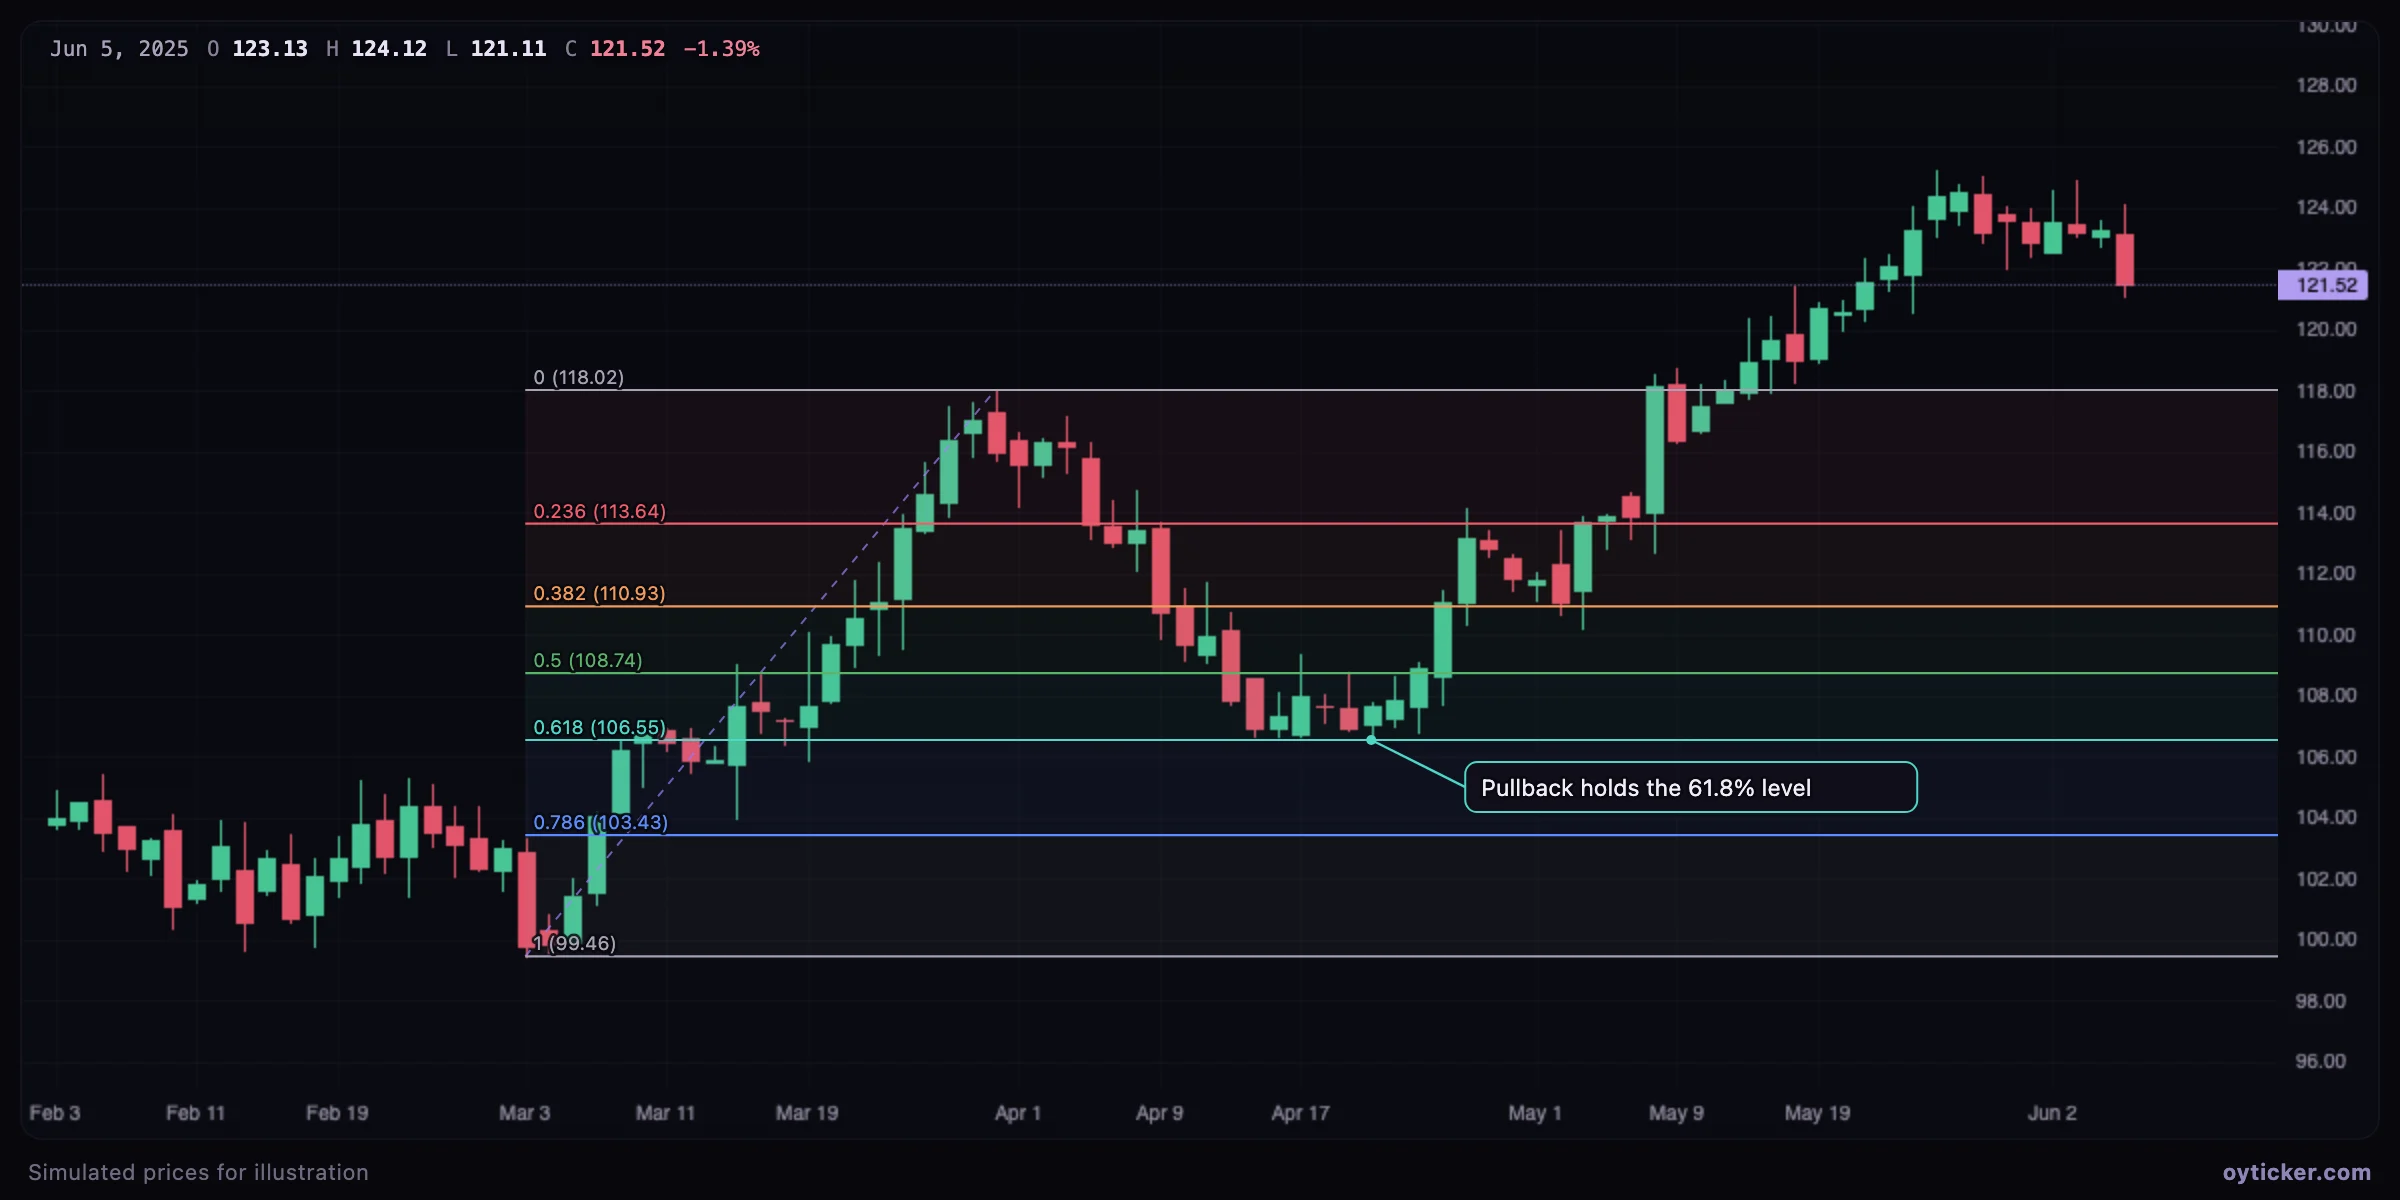
- 23.6–38.2%: shallow. Typical of strong trends; buyers do not wait for a deep discount.
- 50–61.8%: normal. The zone where most pullbacks in an established trend end. Many traders treat 61.8% as the last “healthy” level.
- 78.6%: deep. The trend's structure is at risk; a close beyond it often means the swing's start (100%) will be tested.
- A level is confirmed by price behavior on it (a rejection wick, a reversal candle, a higher low on a shorter timeframe), not by the line alone.
Case study: confluence with a former resistance
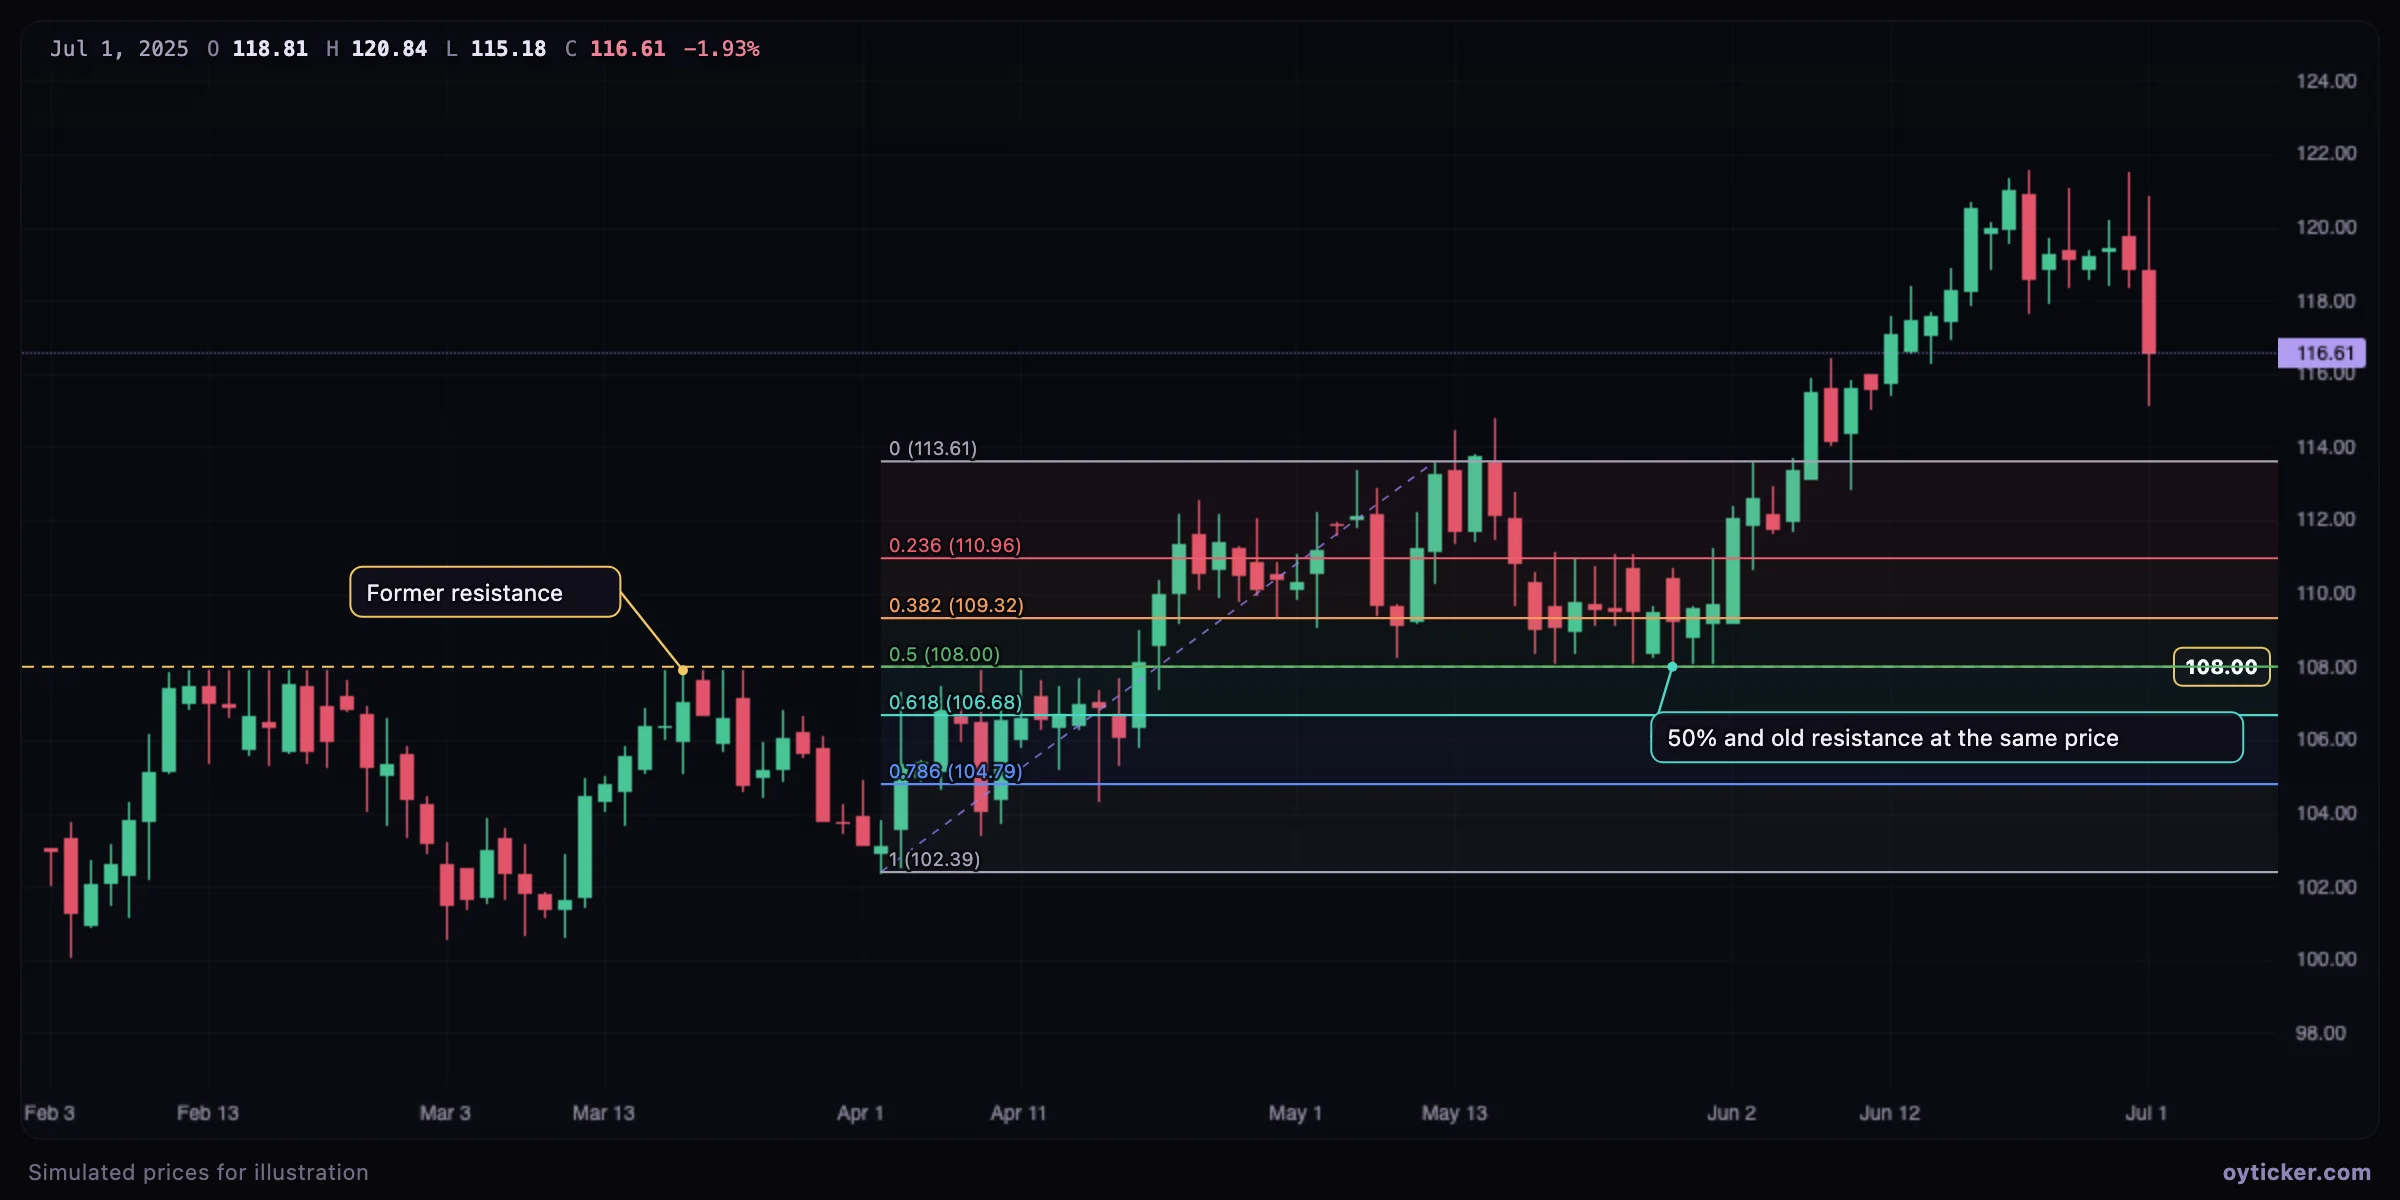
A Fibonacci level is far more significant when it coincides with another, independent reason for buyers to be there: a former resistance turned support, a moving average, a volume node, a round number. Professionals look for these confluences rather than for any single ratio.
Case study: when the retracement fails
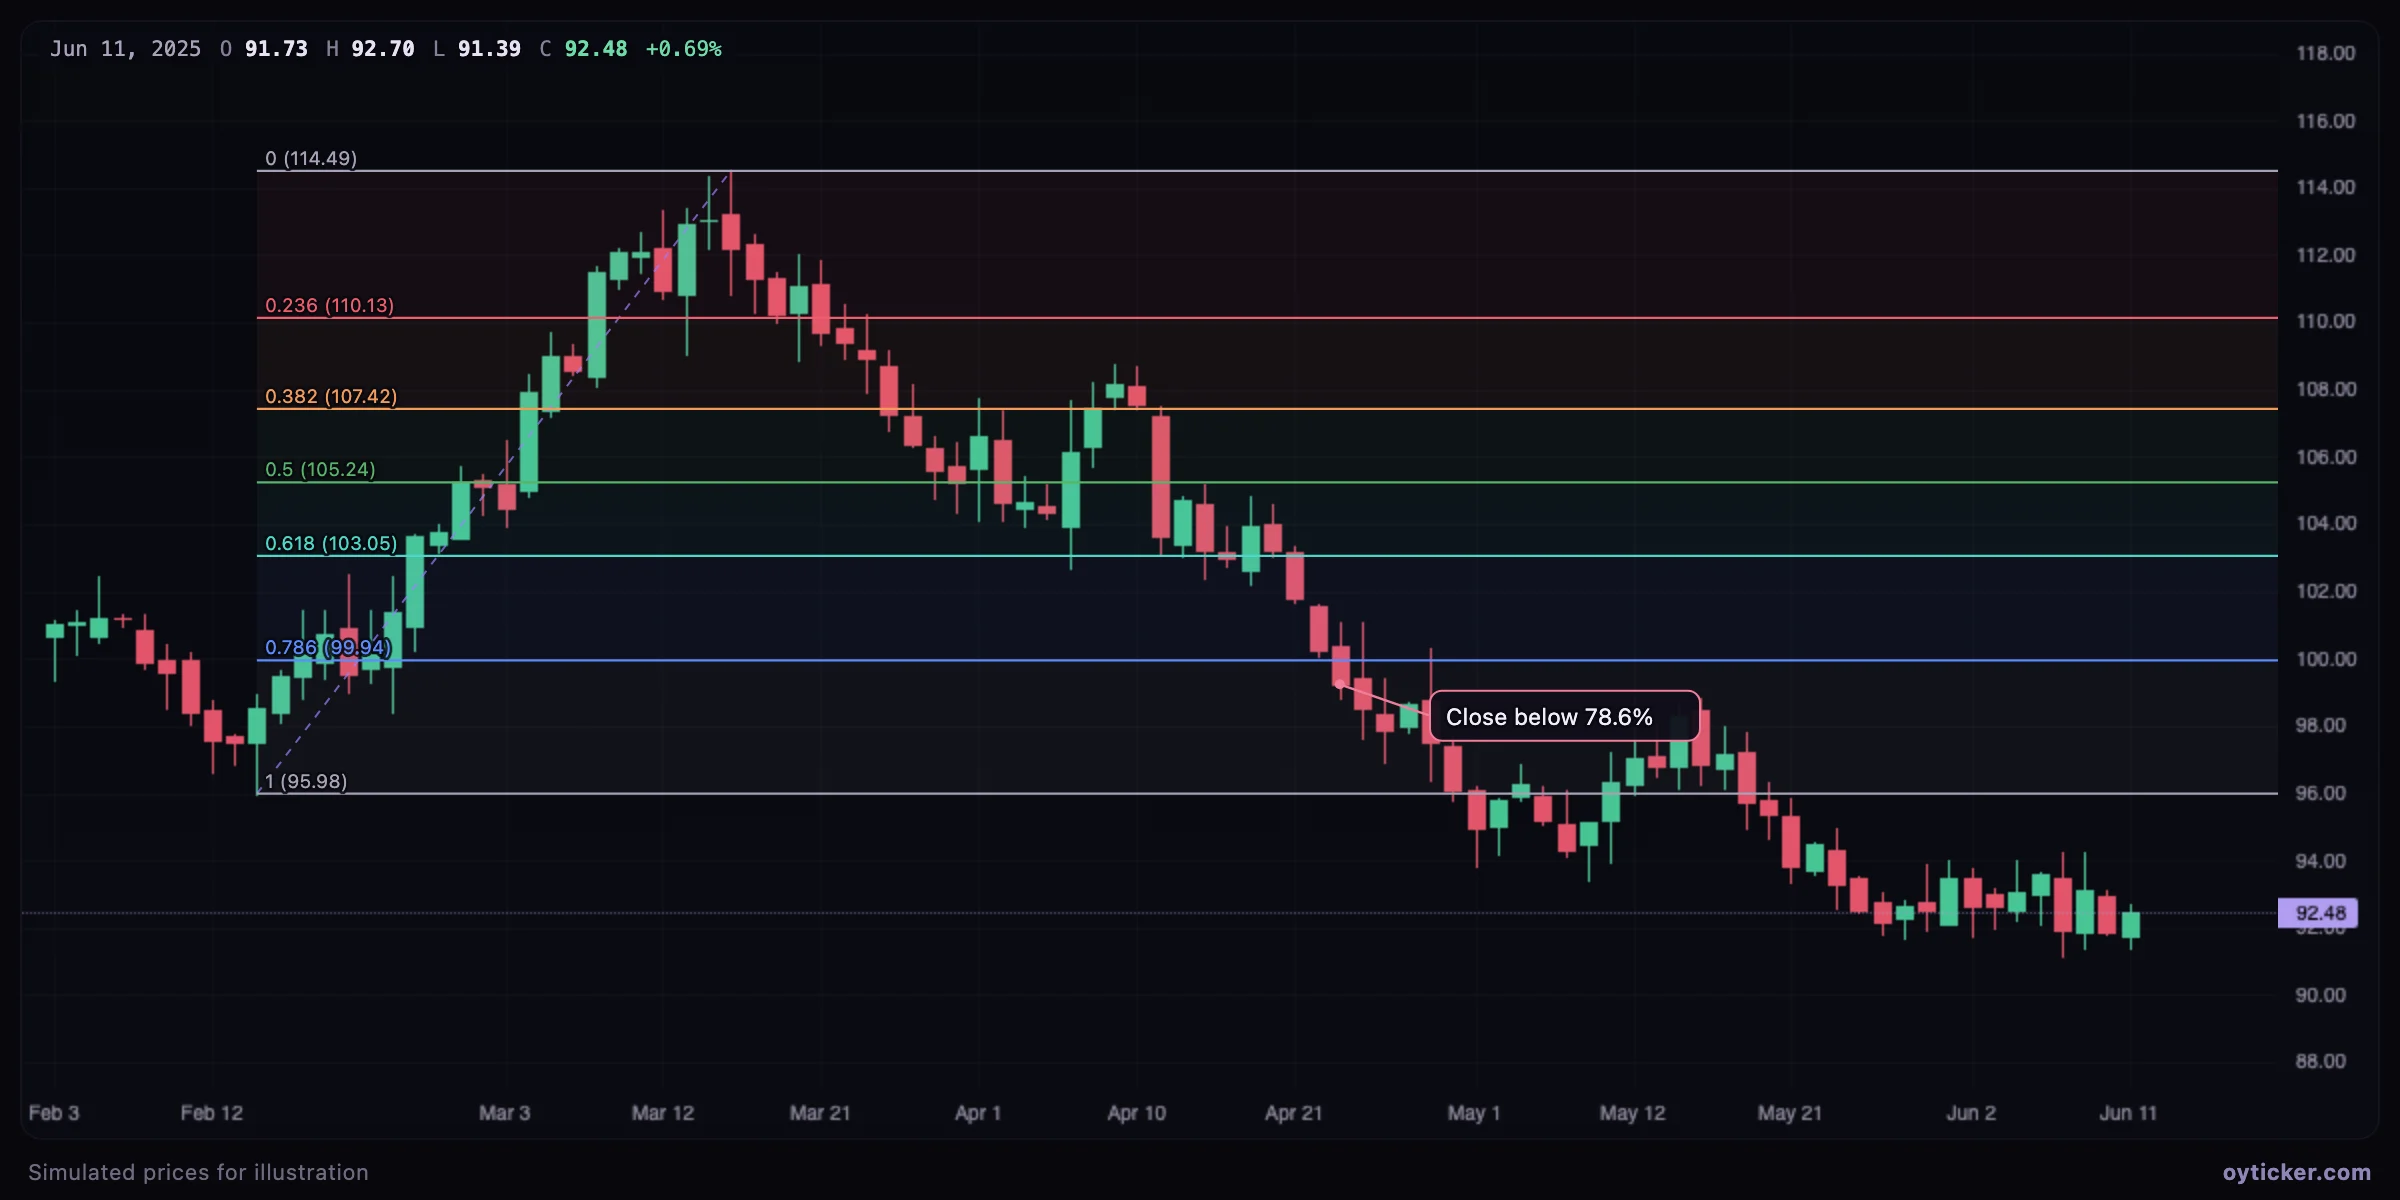
Define what invalidates the idea before using a level: for a long position on a 61.8% pullback, a close below 78.6% (or below the swing's start) means the scenario is wrong. Without that rule, a retracement tool turns every level into a reason to hold a losing trade.
Limits
- With six levels close to each other, price is almost always “near a Fibonacci level”. Only reactions at the level, ideally with confluence, carry information.
- Results depend entirely on the chosen swing: wicks or closes, which high, which low.
- The ratios are a convention, not a law of markets; statistical studies of their predictive power are mixed.
Charts in this guide use simulated prices generated for illustration; levels and outcomes shown are examples, not observations of a real market. Educational content only, not investment advice.