Drawing tools · Fibonacci

Fibonacci speed resistance arcs

Speed resistance arcs are half circles centered on the end of a move, with radii equal to 38.2%, 50%, 61.8% and 100% of the move's length. They cross the move at its retracement levels and extend forward in time, giving support levels (after an advance) that rise as time passes.

What it's for
  • Gauge the speed of a correction after a move.
  • See where support (after an advance) or resistance (after a decline) stands as time passes.
Plus and Pro toolTry it in Analyze
Points
2: start, then end of the move
Plan
Plus and Pro
Levels
0.382 · 0.5 · 0.618 · 1
Depends on
The chart's zoom and scale

Construction

Draw from the start of the move to its end. The arcs are centered on the end: each one crosses the line of the move at its Fibonacci fraction from the end (the 0.5 arc crosses at mid-move), and opens toward the start of the move, below the high of an advance or above the low of a decline.
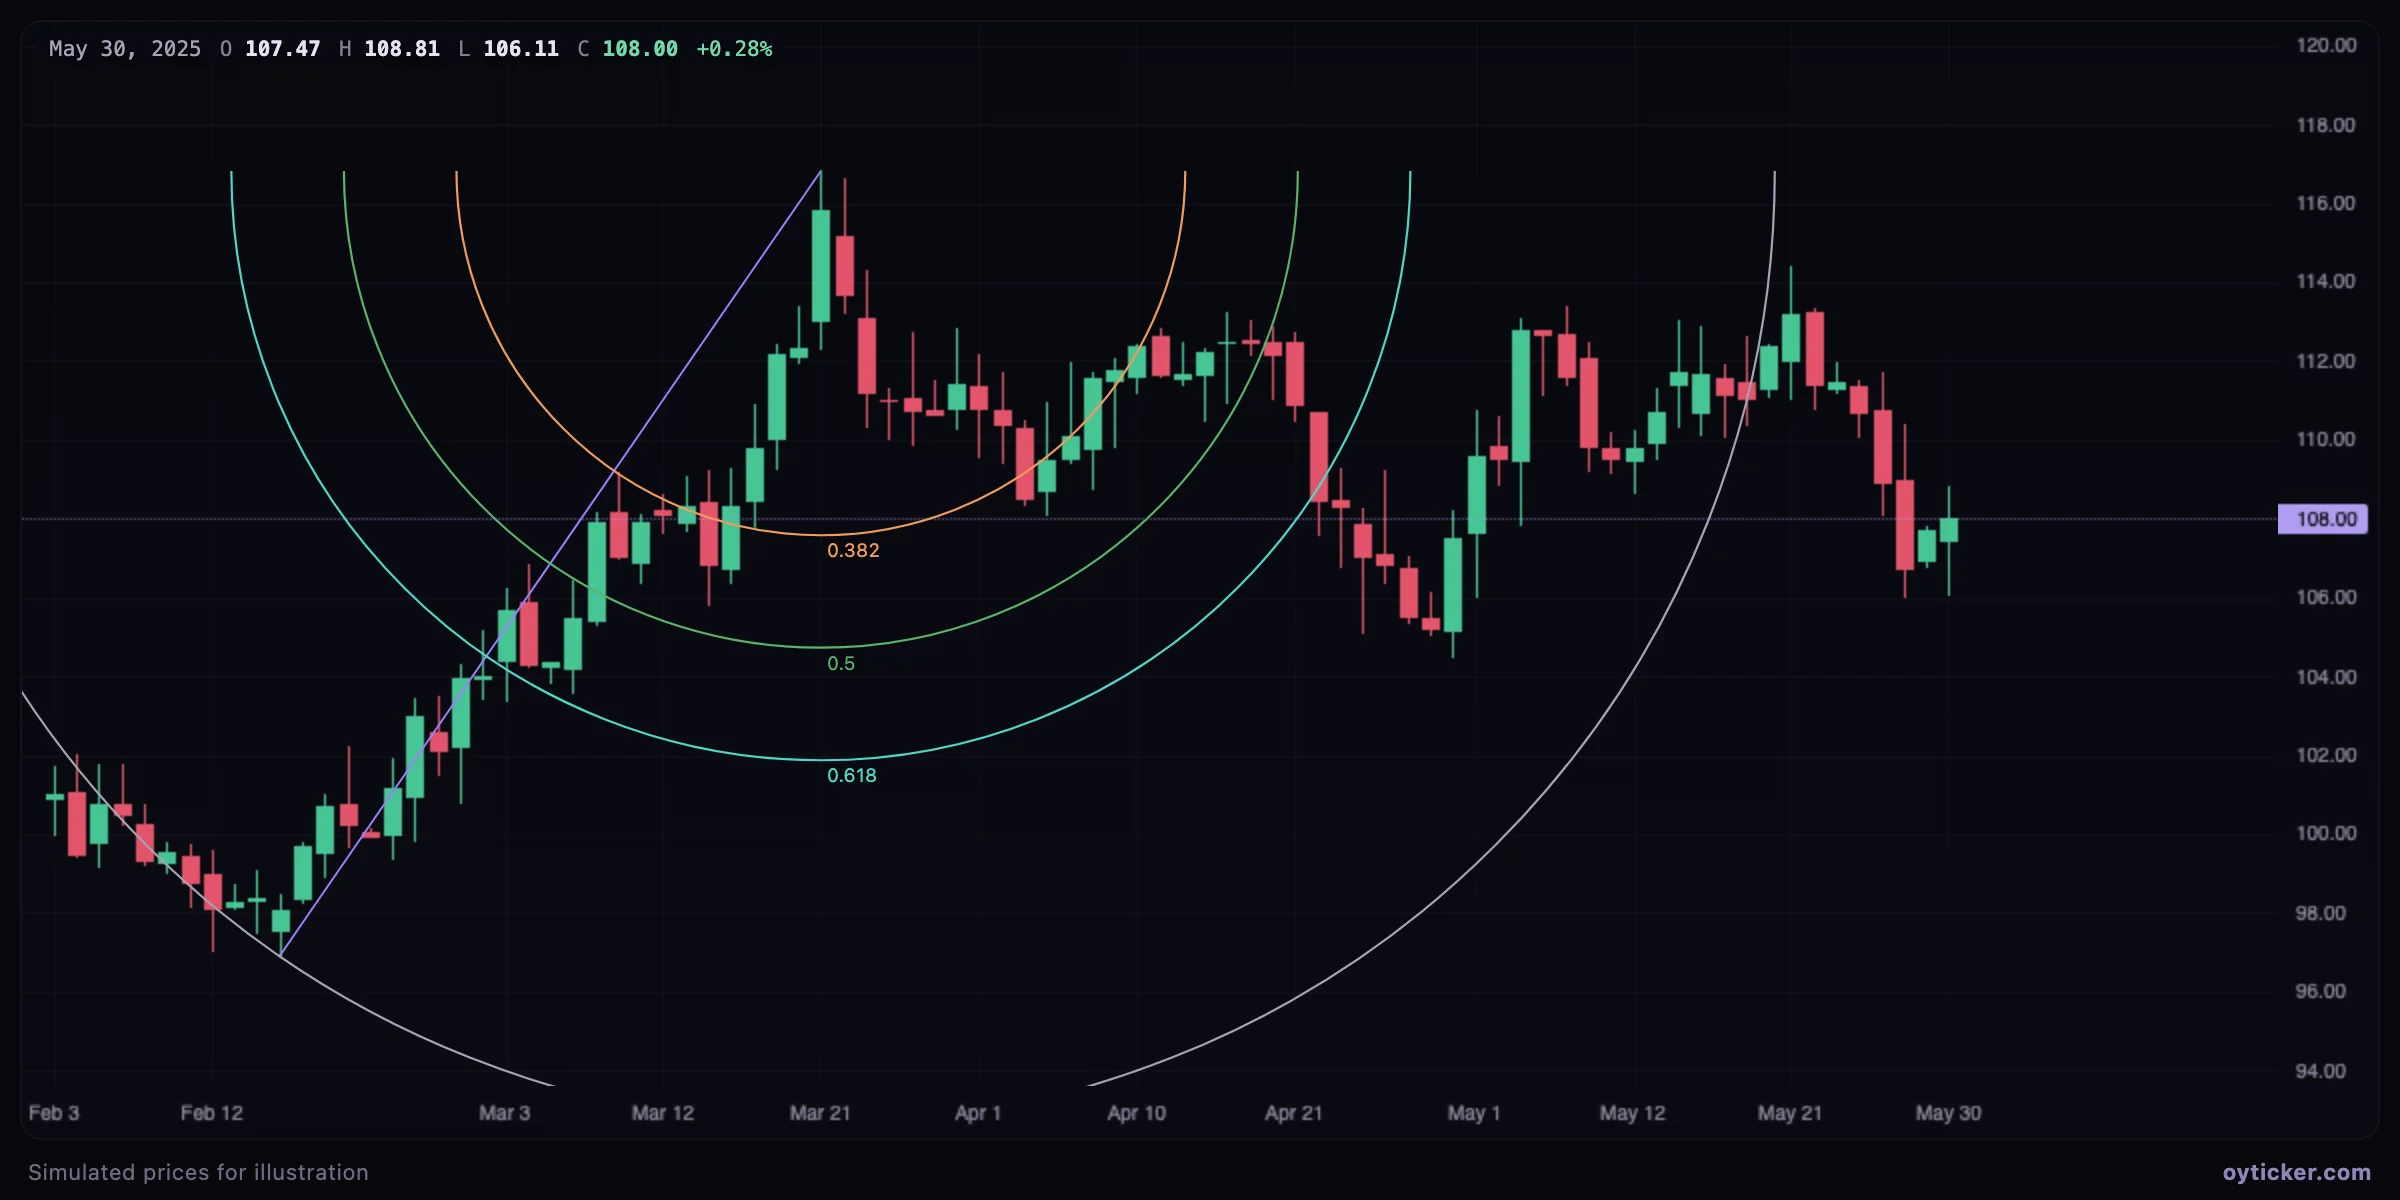
Speed resistance arcs centered on the high of an advance, opening downward and extending to the right
Arcs centered on the high of the advance. To the right of the high, each arc rises toward the high's price as time passes, so a pullback that occurs later meets a higher support than one that occurs immediately.

How to read them

  • The idea is about speed: a correction that stays above the 0.382 arc keeps most of the trend's momentum; falling through the 0.618 arc means the move has lost its speed.
  • Arcs combine time and price: the same 0.5 arc is a deep level just after the high and a shallow one many bars later.

Charts in this guide use simulated prices generated for illustration; levels and outcomes shown are examples, not observations of a real market. Educational content only, not investment advice.

Fibonacci speed resistance arcs: how they are built and read | Oyticker