
Construction and reading
The first click sets the center, usually a major high or low; the second sets the radius of circle 1, usually the opposite end of the swing. Smaller circles are drawn at 0.236 to 0.786 of that radius; the options add 1.618 and 2.618.
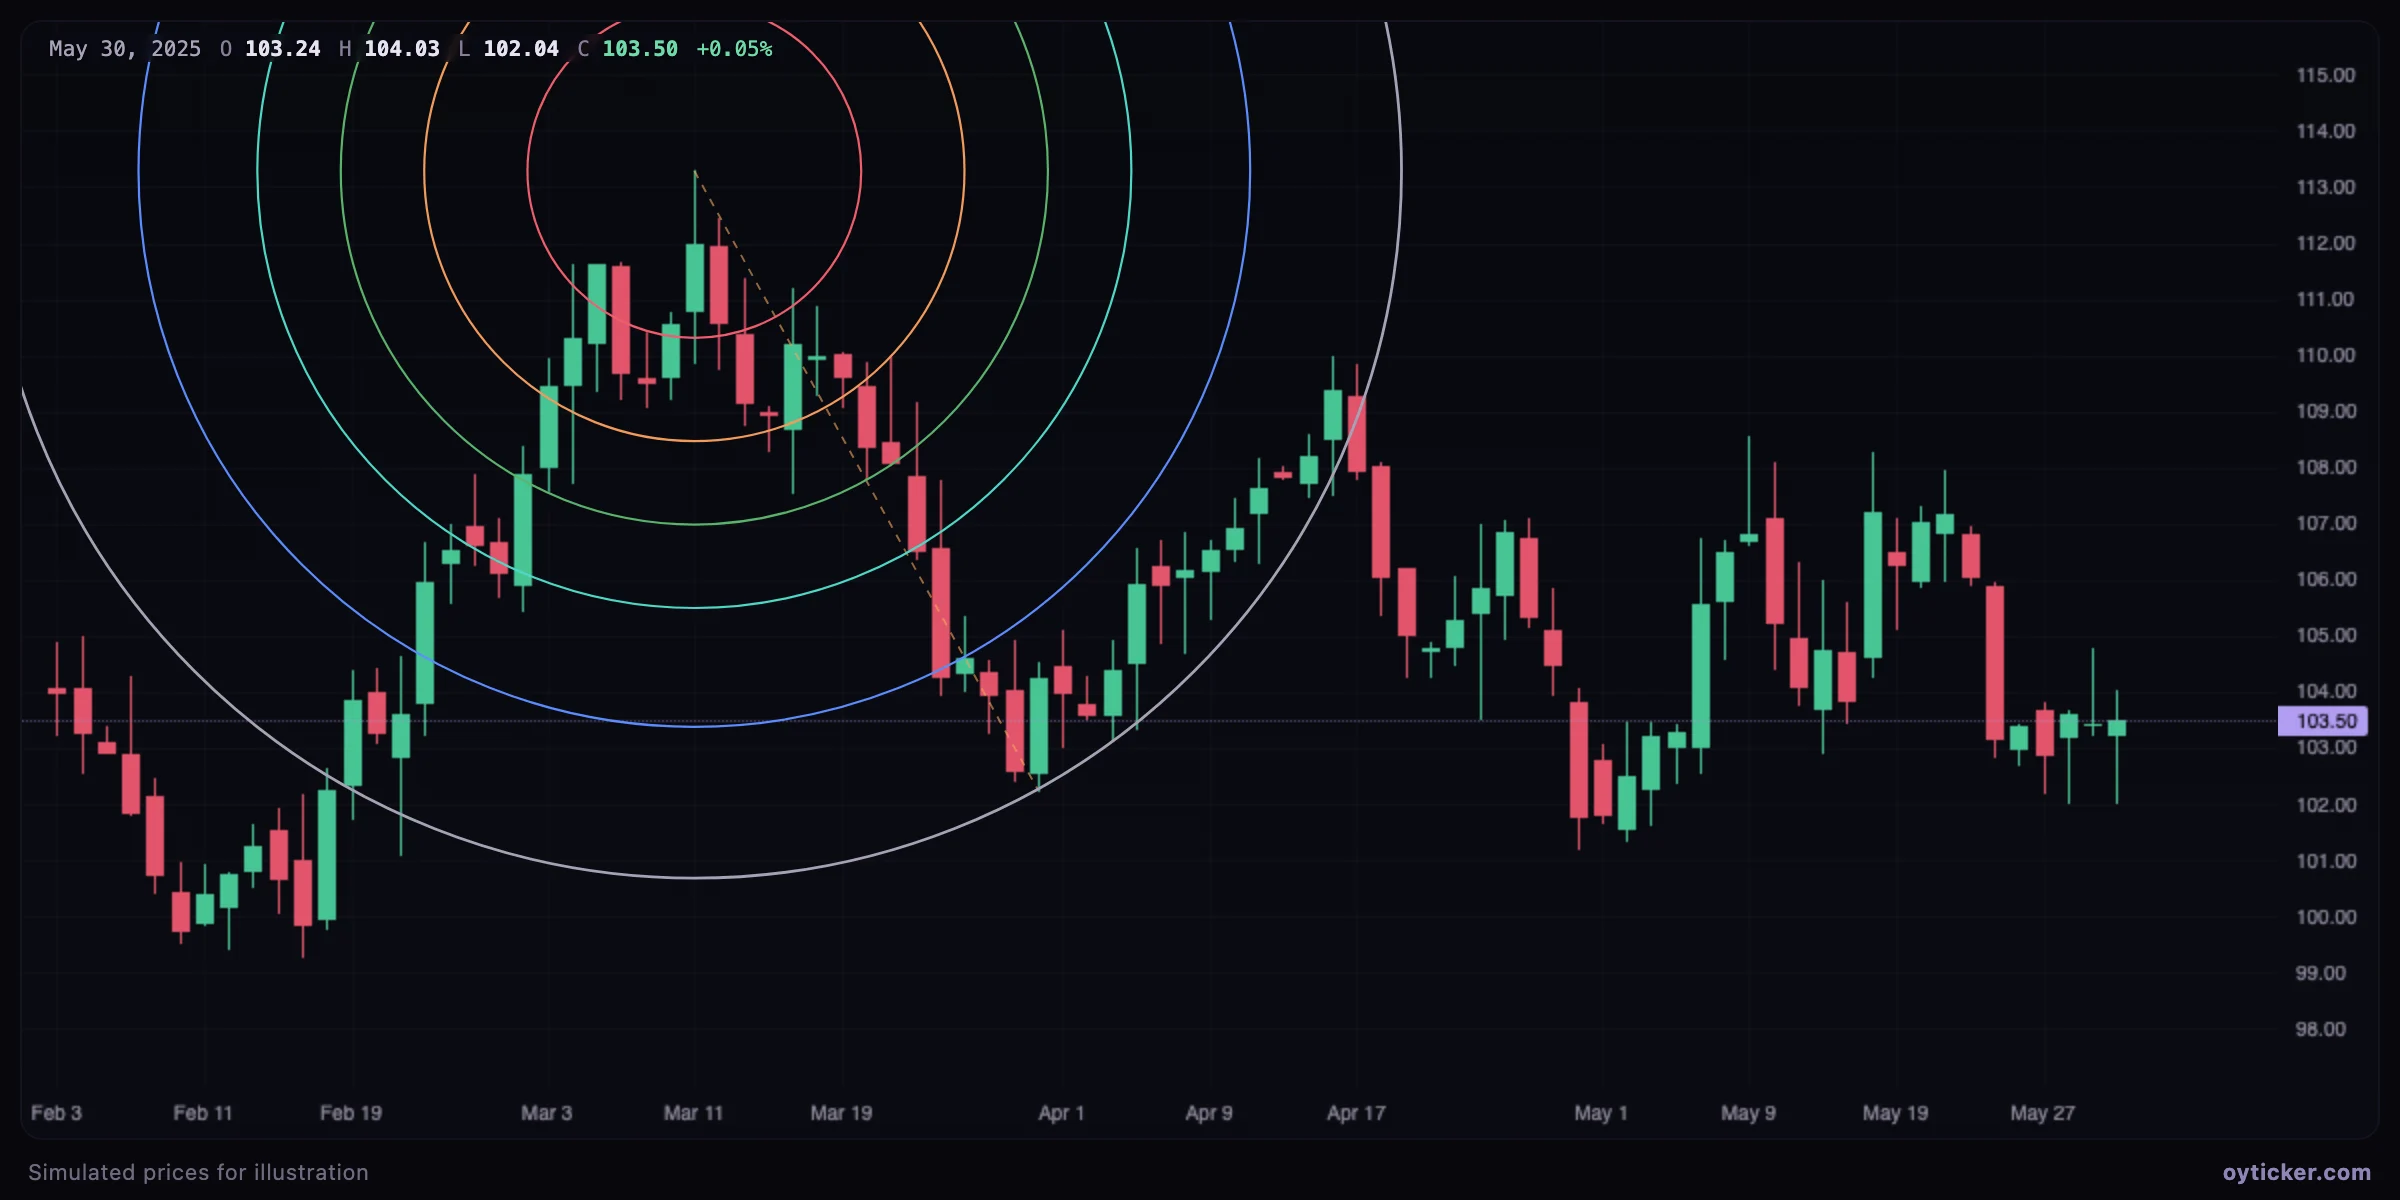
Practitioners watch where price meets a circle: a circle crossed by a later swing high or low is read as a time-and-price support or resistance.
Limits: the scale problem
- Circles are among the most subjective Fibonacci tools; use them as a complement to price levels, never alone.
- To measure pure price levels use a retracement; for pure time use time cycles or cyclic lines.
Charts in this guide use simulated prices generated for illustration; levels and outcomes shown are examples, not observations of a real market. Educational content only, not investment advice.