
Construction
The first point is a major high or low. The second point defines the 1/1 angle: its slope, in price per bar, is the unit. The other lines multiply that slope: 2/1 rises two units of price per bar (steeper), 1/2 one unit every two bars (flatter). Each line is labeled price/time at the right edge.
How to read it
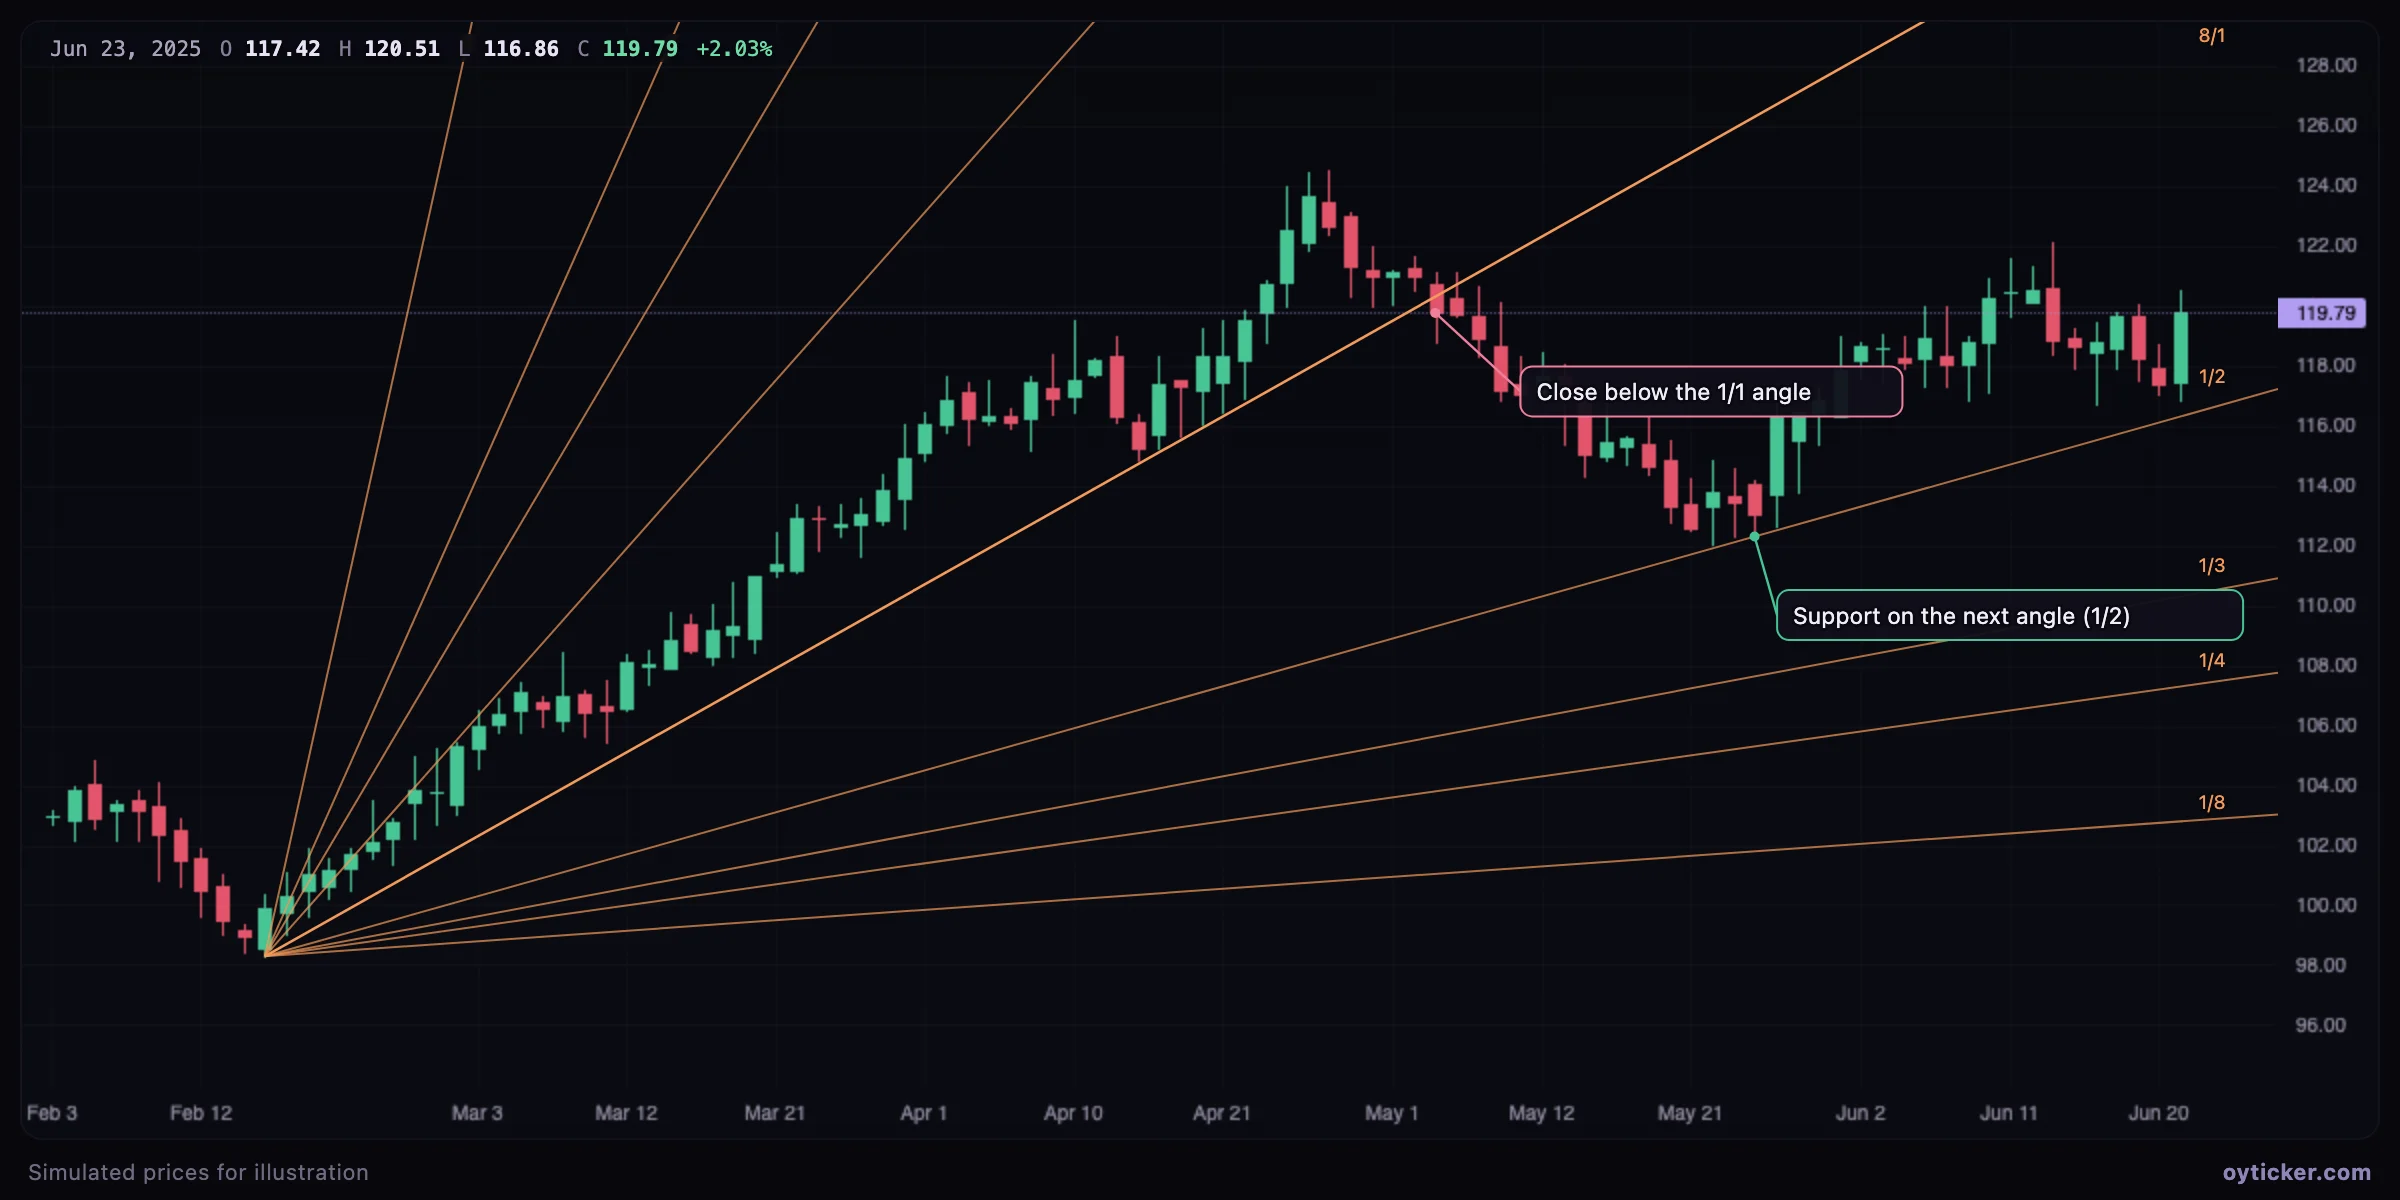
- Above the 1/1 angle: price gains faster than one unit per bar, the trend is strong. Below it, the trend is weaker.
- Angle to angle: a decisive break of an angle points to the next one as the next support (or resistance), the classic Gann reading.
- Steep angles (2/1 and more) are rarely held for long; they describe accelerations.
How to draw it
- Choose Gann → Gann fan.
- Click the major pivot (a low for a rising fan, a high for a falling one).
- Click a second point: the 1/1 line passes through it. Drag it to change the unit; the whole fan rotates accordingly.
Limits
- Without a deliberate choice of unit, a fan can be fitted to almost any chart after the fact.
- Nine lines guarantee that price is always near one of them; only clear reactions count.
- Gann's methods were never formally documented in a testable way; treat them as a framework for reading speed, not as rules.
Charts in this guide use simulated prices generated for illustration; levels and outcomes shown are examples, not observations of a real market. Educational content only, not investment advice.