Drawing tools · Fibonacci

Fibonacci spiral

The Fibonacci spiral is a logarithmic spiral whose radius grows by the golden ratio (≈1.618) every quarter turn. Centered on a pivot and passing through a swing point, it is used by some analysts to look for future turning points where price meets the curve.

What it's for
  • Explore possible time-and-price turning areas along a golden-ratio curve.
  • Complement objective levels; on its own it is the most subjective Fibonacci tool.
Plus and Pro toolTry it in Analyze
Points
2: center, then a point on the spiral
Plan
Plus and Pro
Growth
× 1.618 per quarter turn
Depends on
The chart's zoom and scale

Construction

r(θ) = r₀ · φ^((θ − θ₀) / (π/2))        φ ≈ 1.618

r₀ and θ₀ are the distance and the angle from the center to the second point; Oyticker draws the spiral from the center out to one full turn beyond that point.
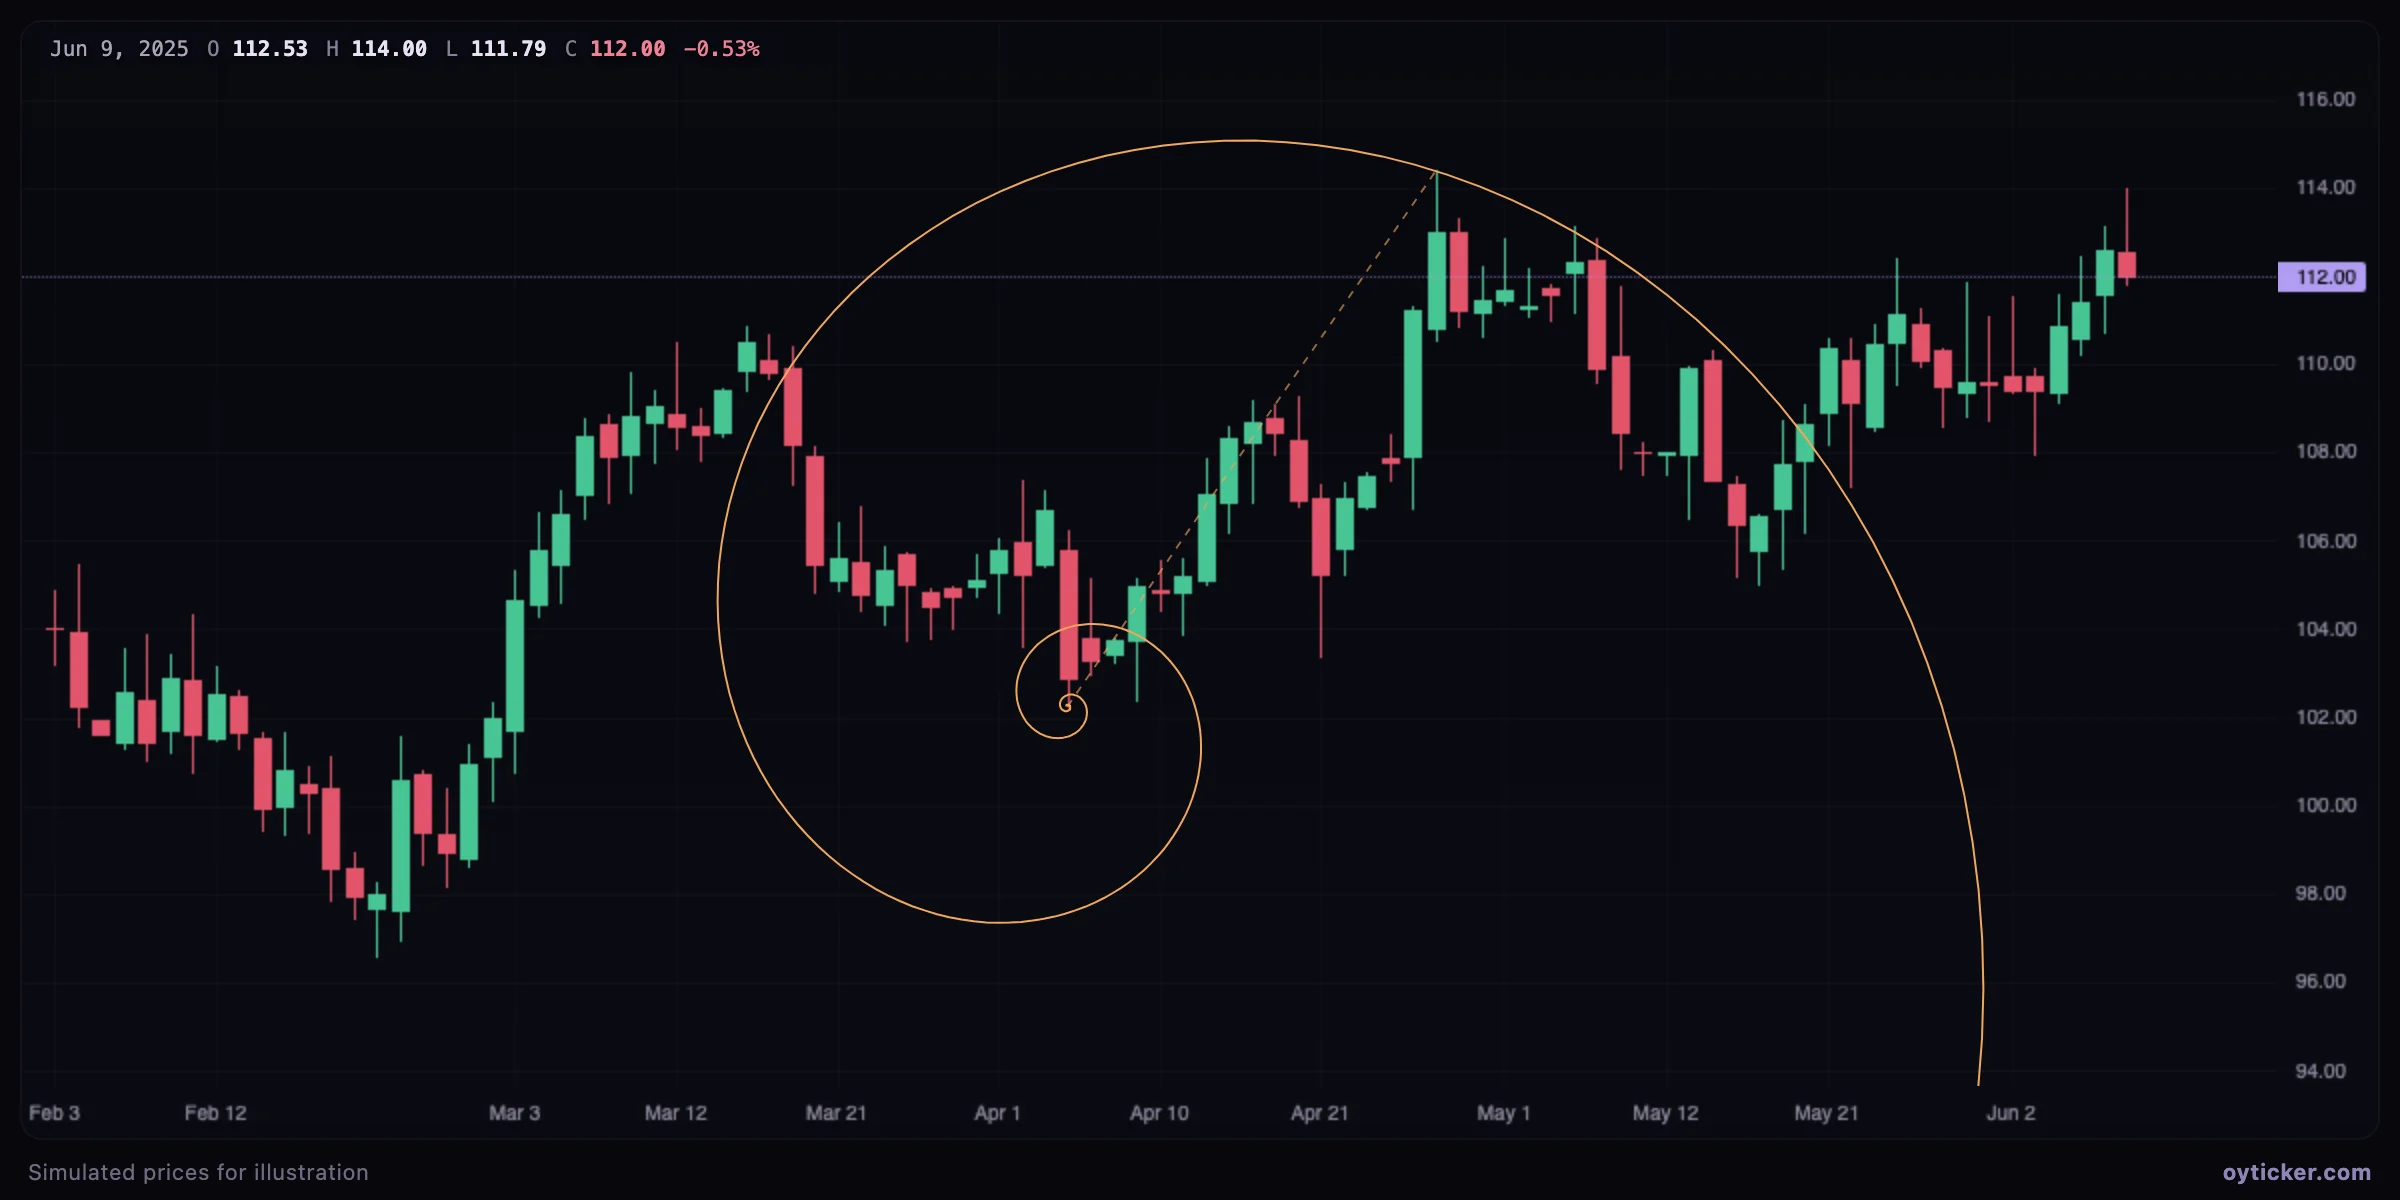
Golden spiral centered on a swing low and passing through the next swing high
A spiral centered on a swing low and passing through the following high. Each quarter turn multiplies the distance to the center by about 1.618.

Use and limits

The spiral is used to look for time-and-price zones where a trend could turn, where the curve meets price. It is the most subjective of the Fibonacci tools: the result depends on the center, the second point and, above all, on the chart's zoom, because the spiral is drawn in screen space.

Charts in this guide use simulated prices generated for illustration; levels and outcomes shown are examples, not observations of a real market. Educational content only, not investment advice.