
Construction and reading
Horizontal lines divide the box's price range, vertical lines divide its duration; the labels on the right are price fractions and those at the bottom time fractions. The 0.5 lines (drawn brighter) are the most important: Gann gave the 50% level of a range special weight, and the middle of the time window is a natural point to expect a turn.
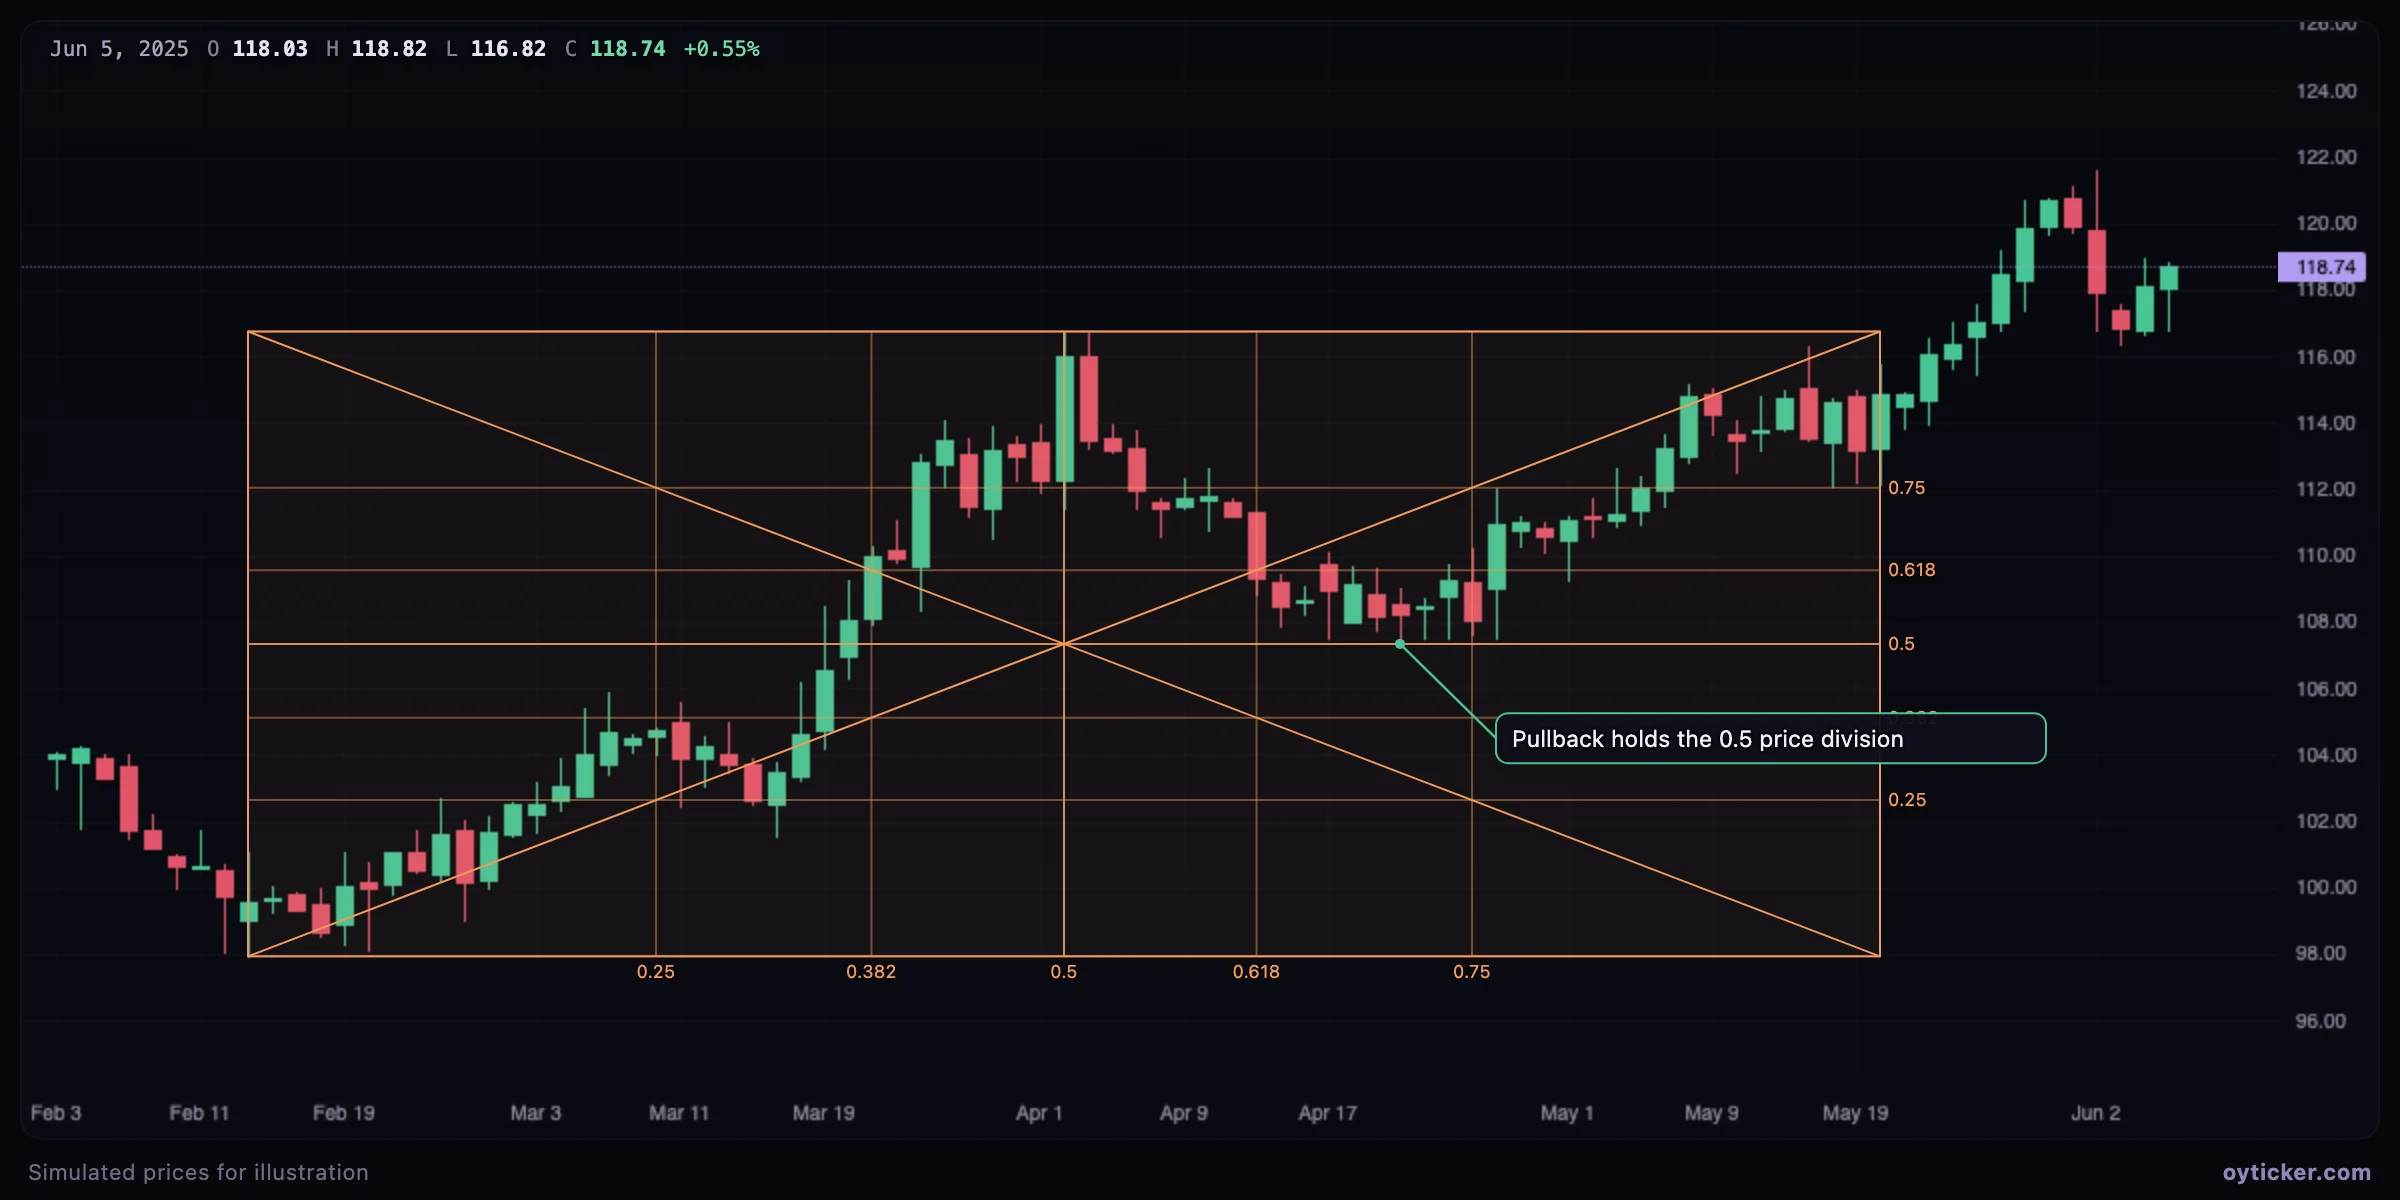
- Price levels inside the box act like retracement levels of the range.
- Crossings of price and time divisions (where a level meets a time line) are watched as possible turning areas.
- The diagonals give the average speed of the range; price above the rising diagonal is ahead of schedule.
How to draw it
- Choose Gann → Gann box.
- Click one corner (for example the major low), then the opposite corner (a high, or a later date at the high's price to include the reaction in the box).
Charts in this guide use simulated prices generated for illustration; levels and outcomes shown are examples, not observations of a real market. Educational content only, not investment advice.