
Construction and reading
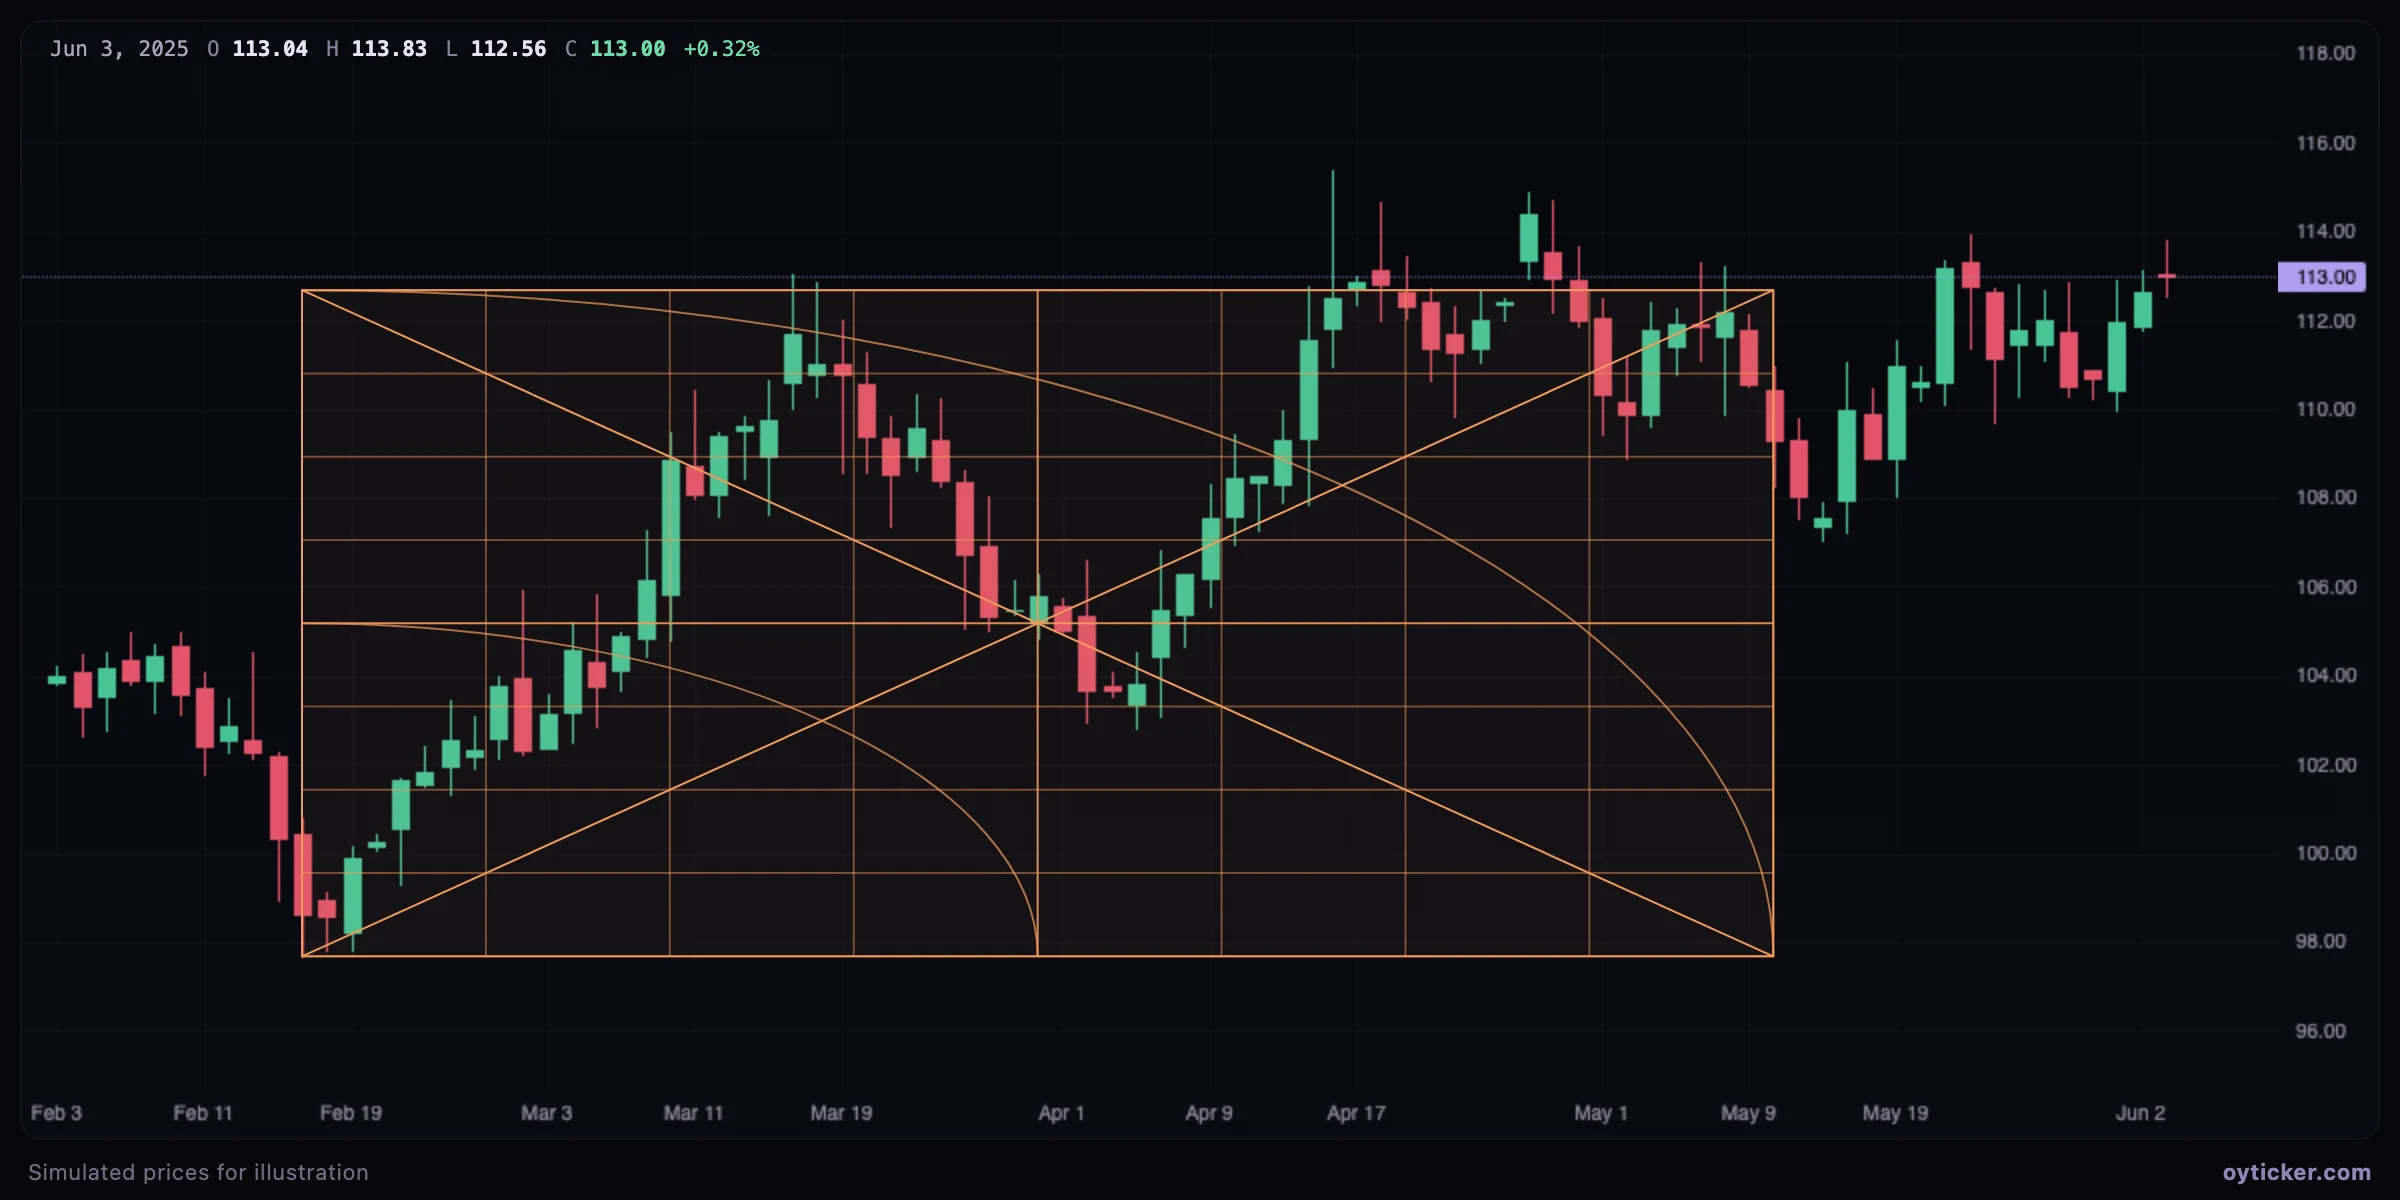
Analysts draw the square from a major pivot so that its height (price) and width (time) are the same number of units, using the same price-per-bar unit as their Gann fan. Turning points are then expected near the time divisions, especially the half (4/8), and price reactions near the horizontal eighths.
How to draw it
- Choose Gann → Gann square and click the pivot corner.
- Click the opposite corner so that the price range and the number of bars match your chosen unit (for example 15 points over 60 bars at 0.25 per bar).
Limits
The square is the most interpretive of the Gann tools: with eight divisions in each direction and curves crossing the grid, some line is always close to price. Use it to organize time expectations, and require confirmation from price itself.
Charts in this guide use simulated prices generated for illustration; levels and outcomes shown are examples, not observations of a real market. Educational content only, not investment advice.