
The ratios Oyticker checks
Ratios are measured in price. AB/XA is the retracement of XA at B, BC/AB the retracement of AB at C, CD/BC the extension of BC, and AD/XA the retracement (below 1) or extension (above 1) of XA at D. On the chart, each ratio is written on the dashed line joining the two points it compares.
| Pattern | B (AB/XA) | C (BC/AB) | D (AD/XA) | CD/BC |
|---|---|---|---|---|
| Gartley | 0.618 | 0.382–0.886 | 0.786 | 1.272–1.618 |
| Bat | 0.382–0.5 | 0.382–0.886 | 0.886 | 1.618–2.618 |
| Butterfly | 0.786 | 0.382–0.886 | 1.272–1.618 | 1.618–2.24 |
| Crab | 0.382–0.618 | 0.382–0.886 | 1.618 | 2.24–3.618 |
| Deep Crab | 0.886 | 0.382–0.886 | 1.618 | 2.24–3.618 |
| Cypher | 0.382–0.618 | C extends XA to 1.272–1.414 (XC/XA) | D at 0.786 of XC | — |
Ratios follow Scott Carney's definitions (Gartley's original pattern dates from 1935); the Cypher is credited to Darren Oglesbee. Every ratio is accepted within ±3%. The pattern is bullish when A is above X (D completes at a low, where a long is considered) and bearish when A is below X.
Examples
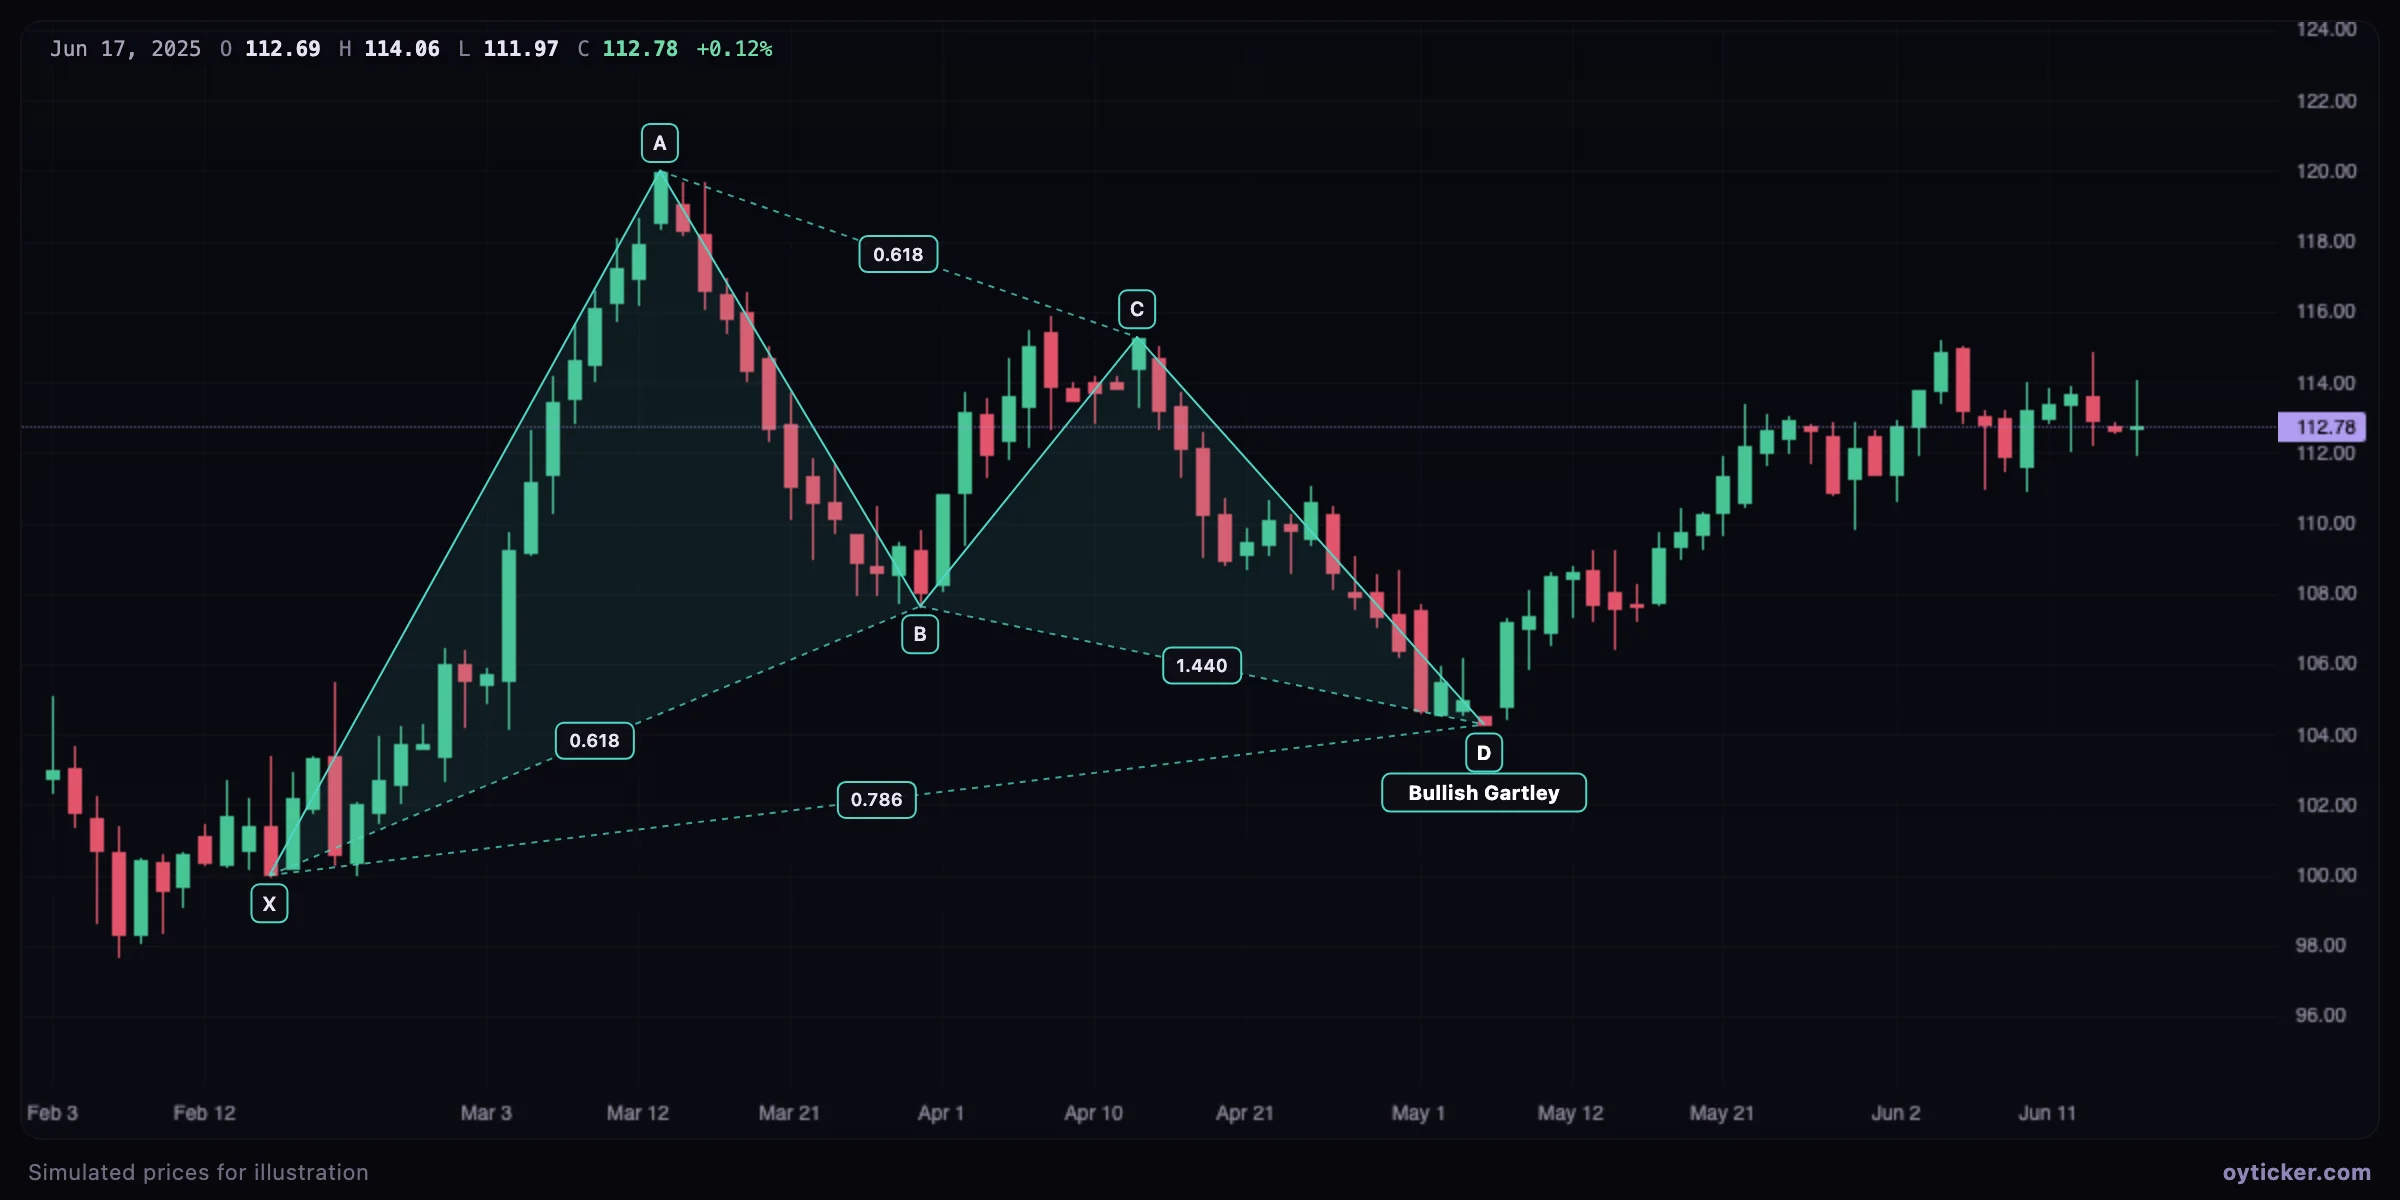
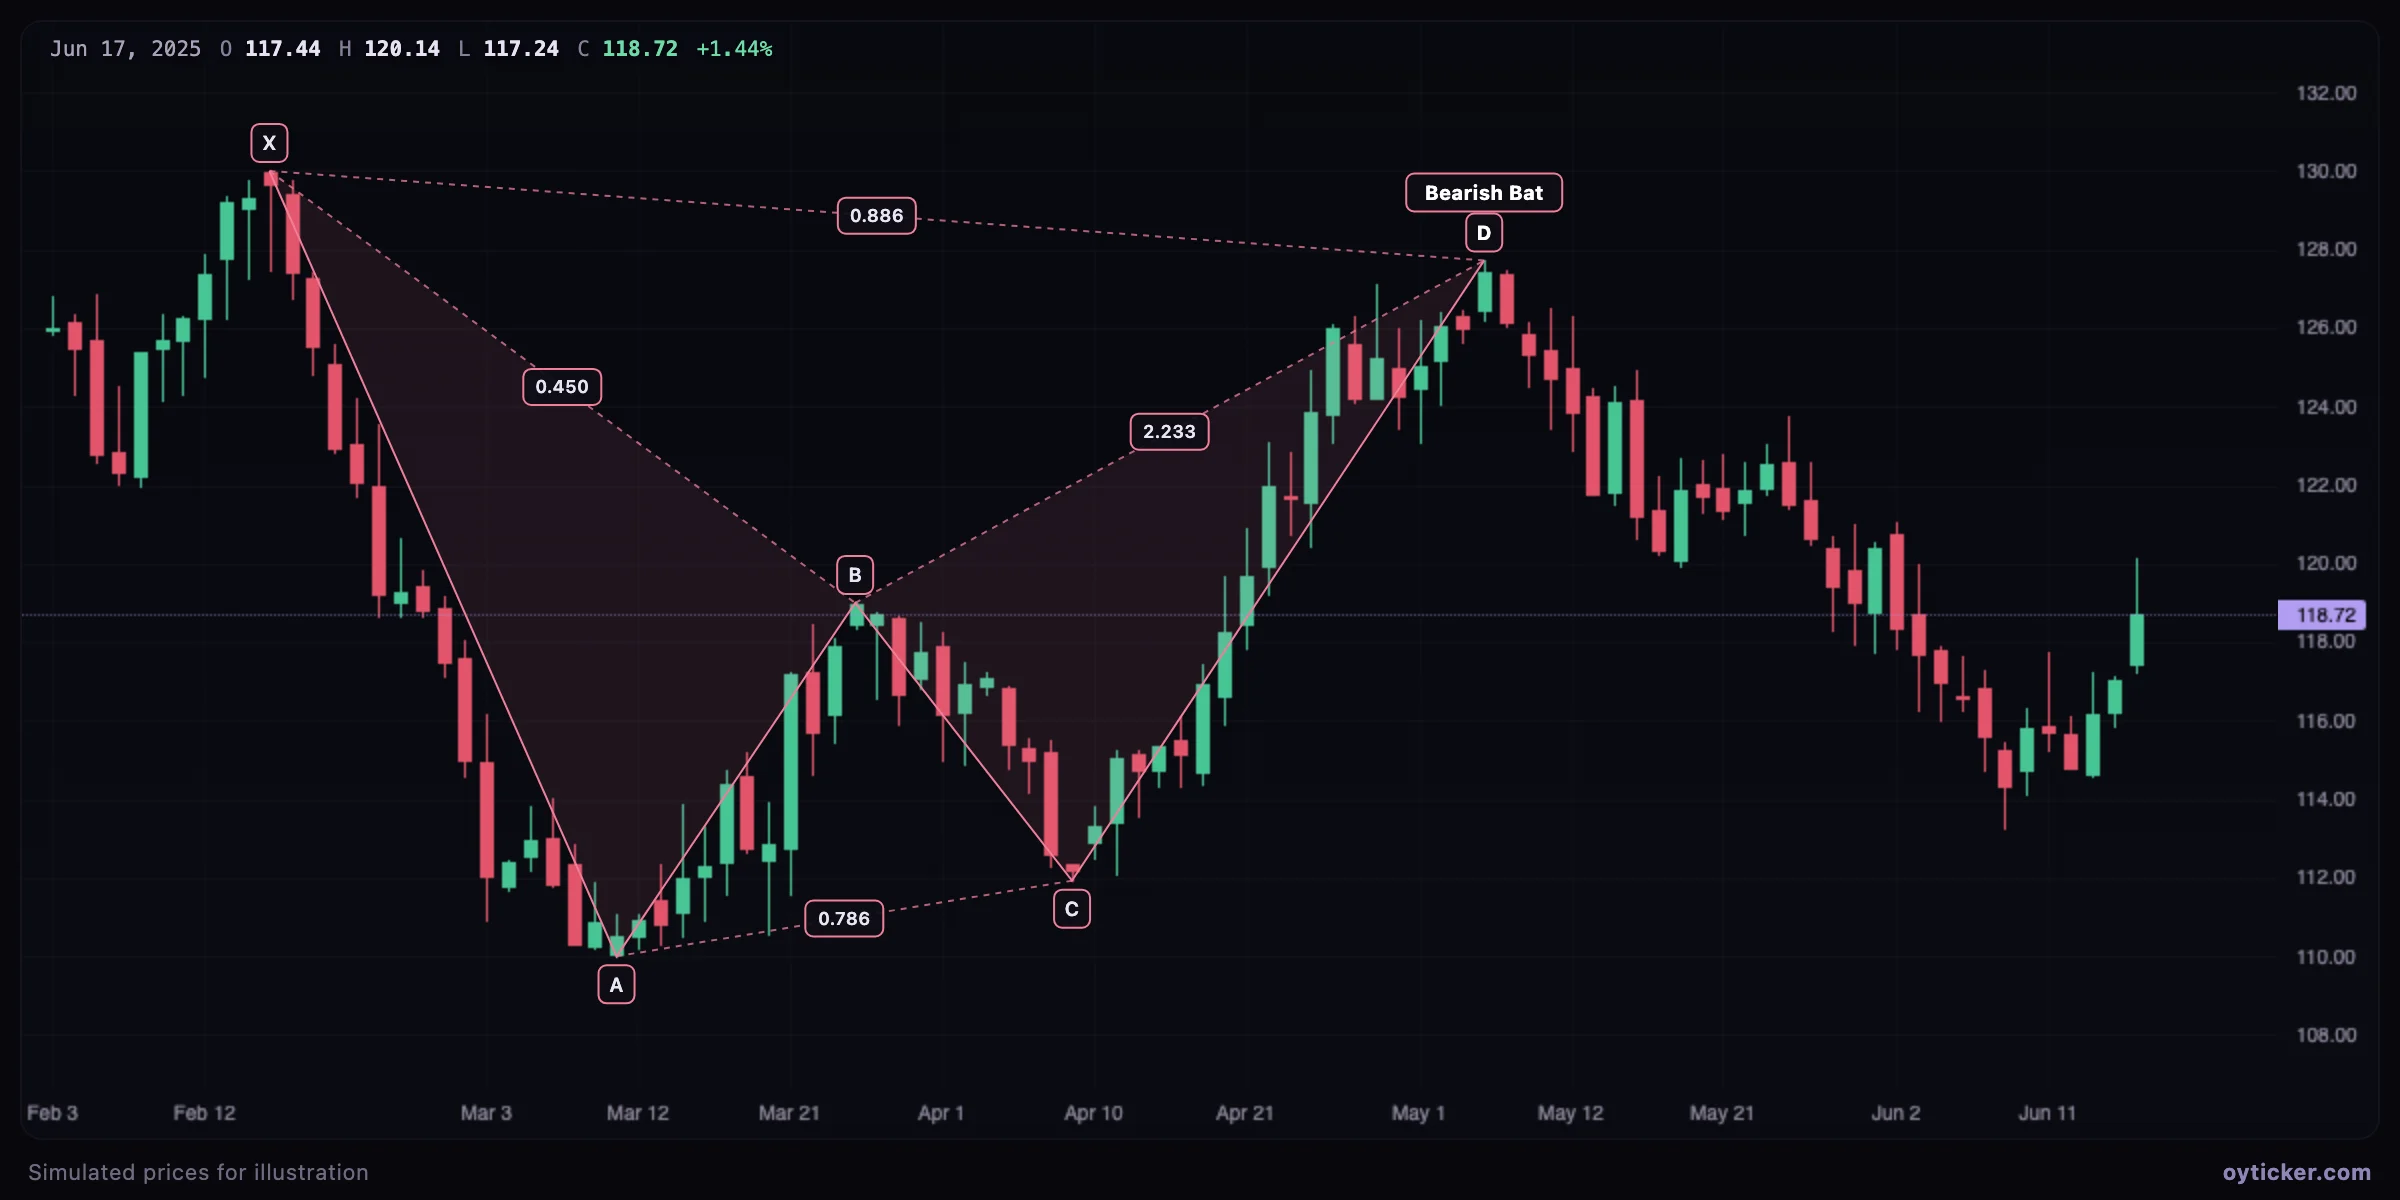
Reading the completion point
- D is a potential reversal zone: the ratios tell you where to watch, not that price will turn. Wait for a reaction (a reversal candle, a momentum divergence) before acting.
- A common invalidation is a clear move beyond X (or beyond the next Fibonacci level of XA for patterns that complete beyond X).
- Usual targets after a reaction are the 38.2% and 61.8% retracements of the CD leg.
How to draw it
- Choose Patterns → Harmonic XABCD.
- Click X, A, B, C and D on alternating swing points.
- Read the ratios and the name under D. If no standard set matches, Oyticker says so; adjusting a point moves all ratios at once.
Limits
Harmonic trading relies on precise swing selection; a few cents on X or A change the ratios. The definitions vary slightly between authors, and patterns found after the fact are always cleaner than those traded live.
Charts in this guide use simulated prices generated for illustration; levels and outcomes shown are examples, not observations of a real market. Educational content only, not investment advice.