
Anatomy of the pattern
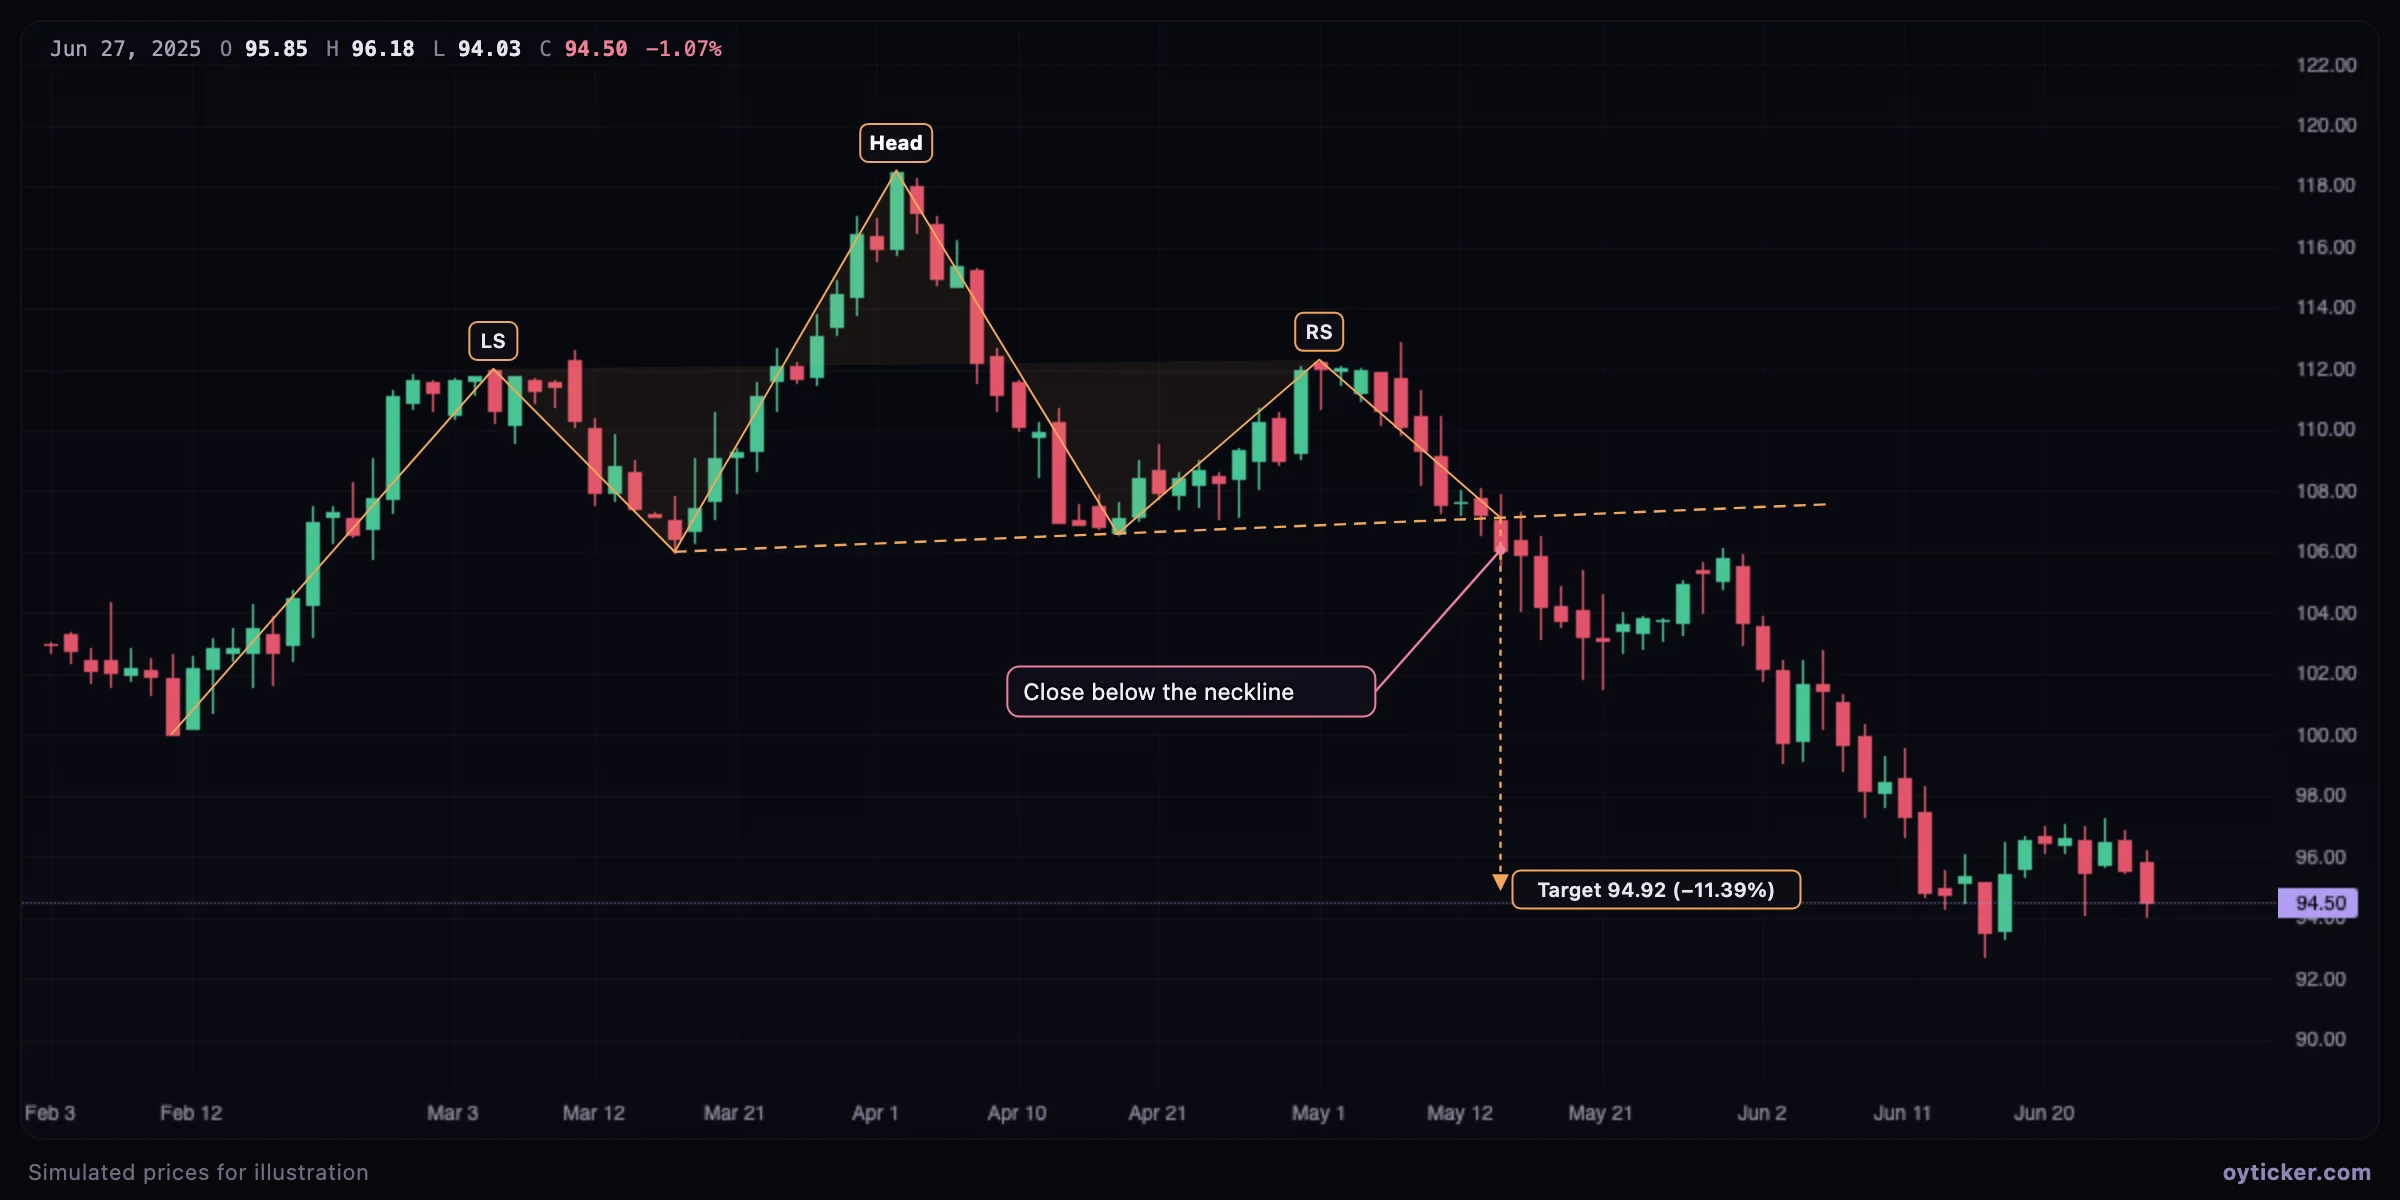
- Left shoulder (LS): a peak in an existing uptrend.
- Head: a higher peak, the last new high of the trend.
- Right shoulder (RS): a lower peak; buyers can no longer reach the head's high.
- Neckline: the line through the two troughs, horizontal or sloped.
- Break: a close below the neckline completes the top; until then it is only a possible pattern.
How to draw it in Oyticker
- Choose Patterns → Head and shoulders.
- Click the seven points in order: the start of the move into the left shoulder, the left shoulder, the first trough, the head, the second trough, the right shoulder, and the point where price crosses the neckline.
- Oyticker draws the neckline through the two troughs, shades the pattern, and computes the target with its distance in percent. If the head is not above both shoulders (below for an inverse pattern), the tool says so instead of showing a target.
The measured target
height = head − neckline(at the head's time)
target = neckline(at the break) − height
In a top the height is positive and the target lies below the neckline; in an inverse pattern the head is below the neckline, the height is negative and the target lies above. With a sloped neckline the height is measured vertically at the head and projected from the neckline's value at the break.
The target is a minimum objective often used to judge the reward of a trade, not a guaranteed destination. Many traders take profits around it and keep a stop above the right shoulder (below it for an inverse pattern).
Case study: inverse head and shoulders
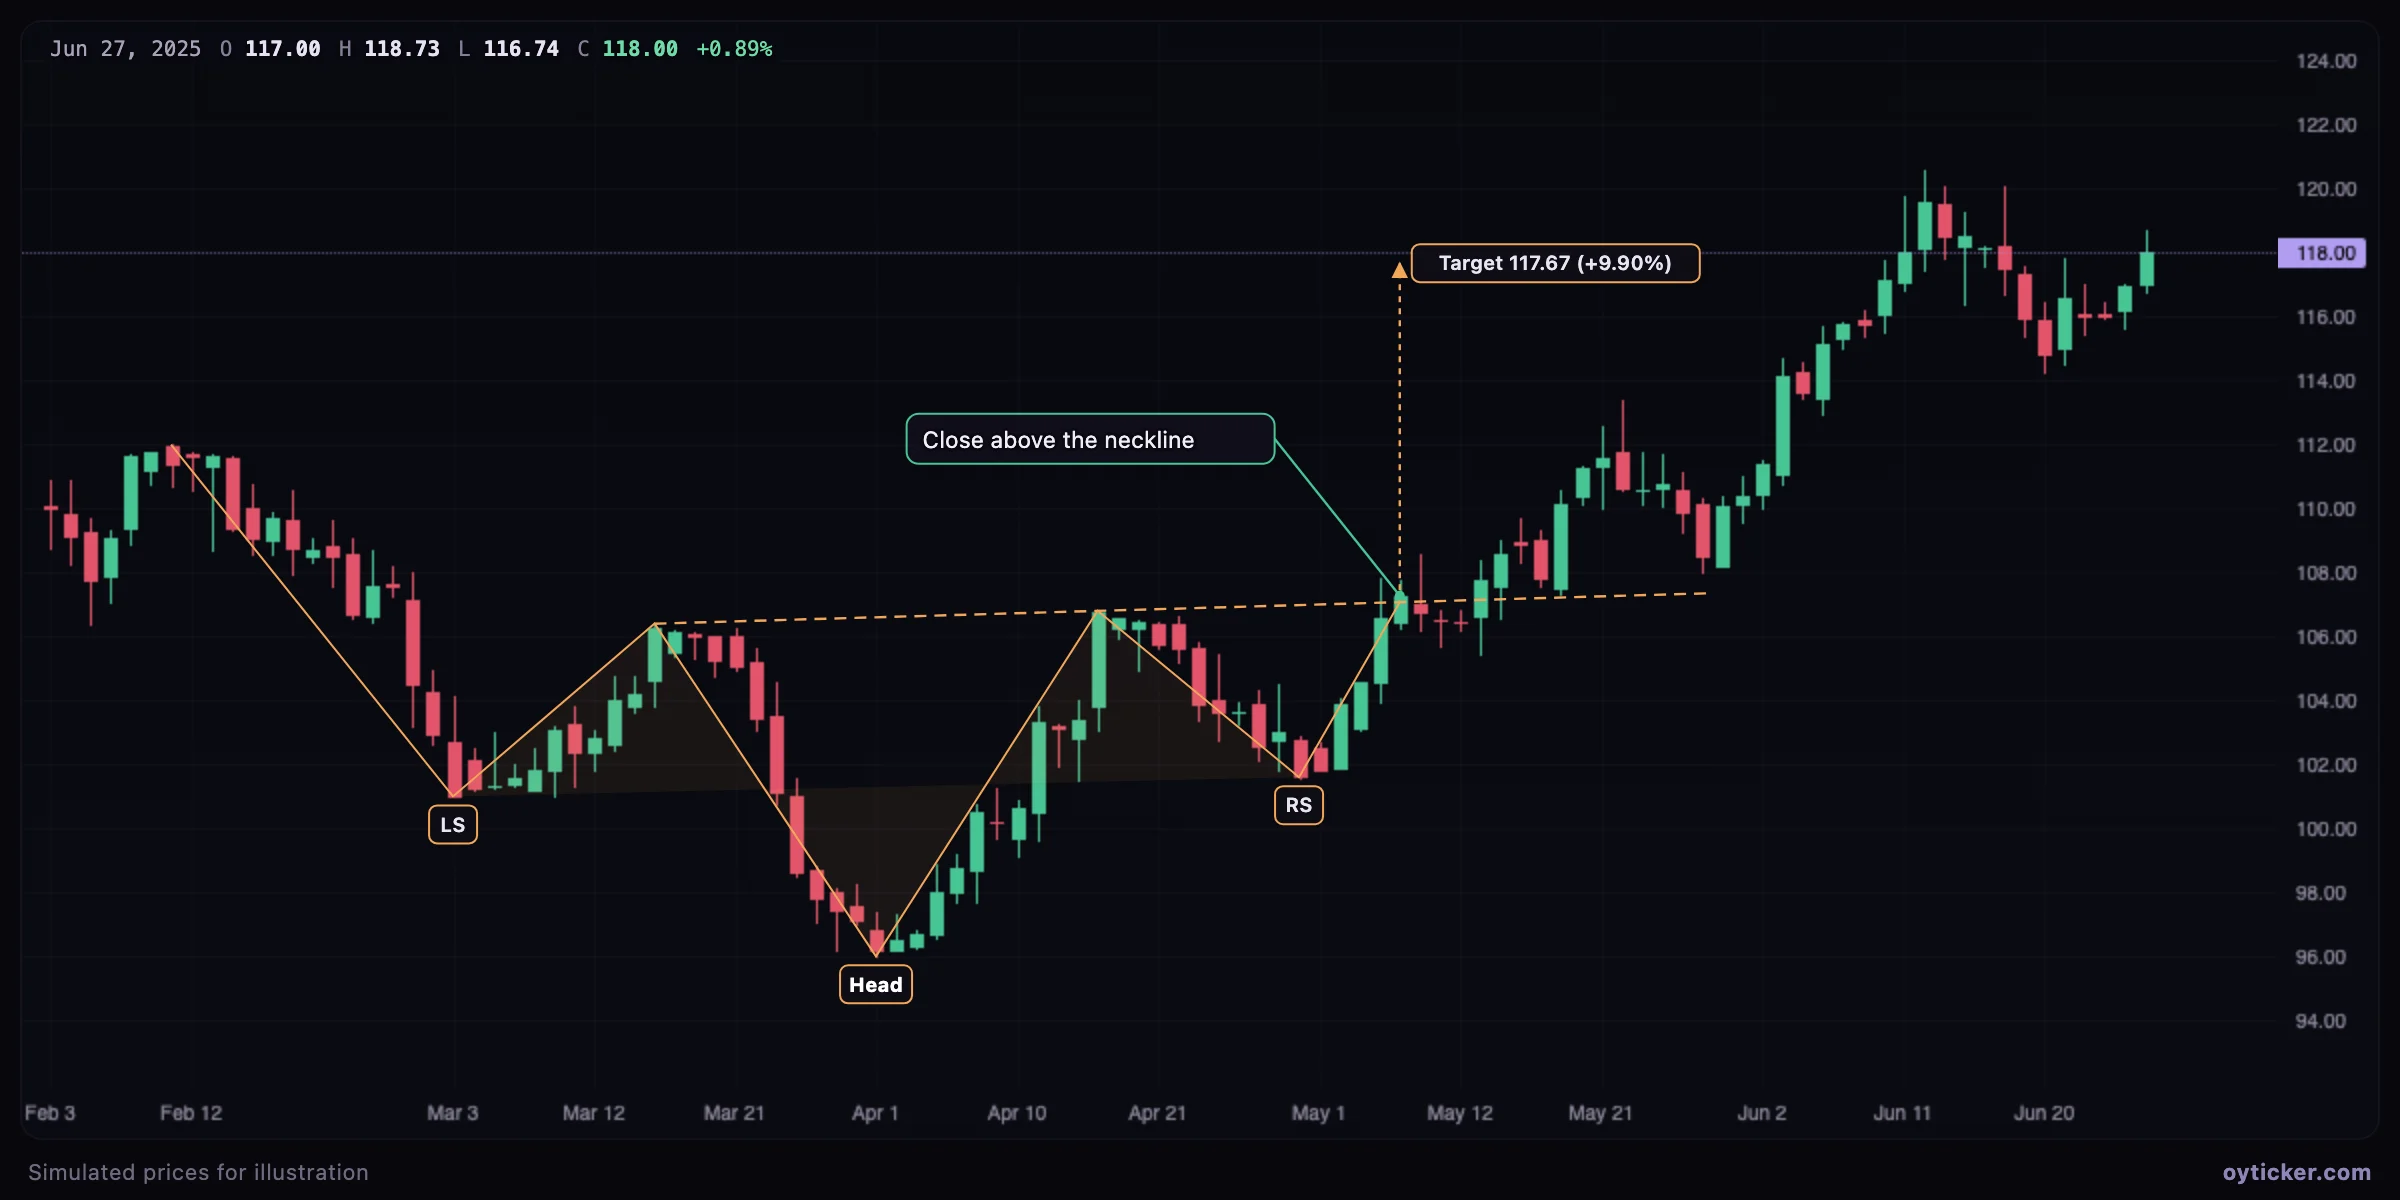
Volume is a classic confirmation: in a top, activity often fades on the head and the right shoulder and expands on the break; in a bottom, the breakout above the neckline is ideally made on rising volume.
Limits and common mistakes
- Anticipating the break. Before the close through the neckline there is no pattern, only three peaks. Many “right shoulders” turn into continuations.
- Ignoring context. A top needs a prior uptrend to reverse; three peaks inside a range mean little.
- Retests. Price often comes back to the neckline after the break; a close back through it invalidates the pattern.
Charts in this guide use simulated prices generated for illustration; levels and outcomes shown are examples, not observations of a real market. Educational content only, not investment advice.