
Why start a level at its origin
A level exists because of an event: a swing high where sellers took control, a low where buyers stepped in, the close before a gap. Starting the line at that event documents why the level matters and makes it obvious whether price has been back to it since. A level that has not been revisited is often called untested; the first return to it is usually the most significant one.
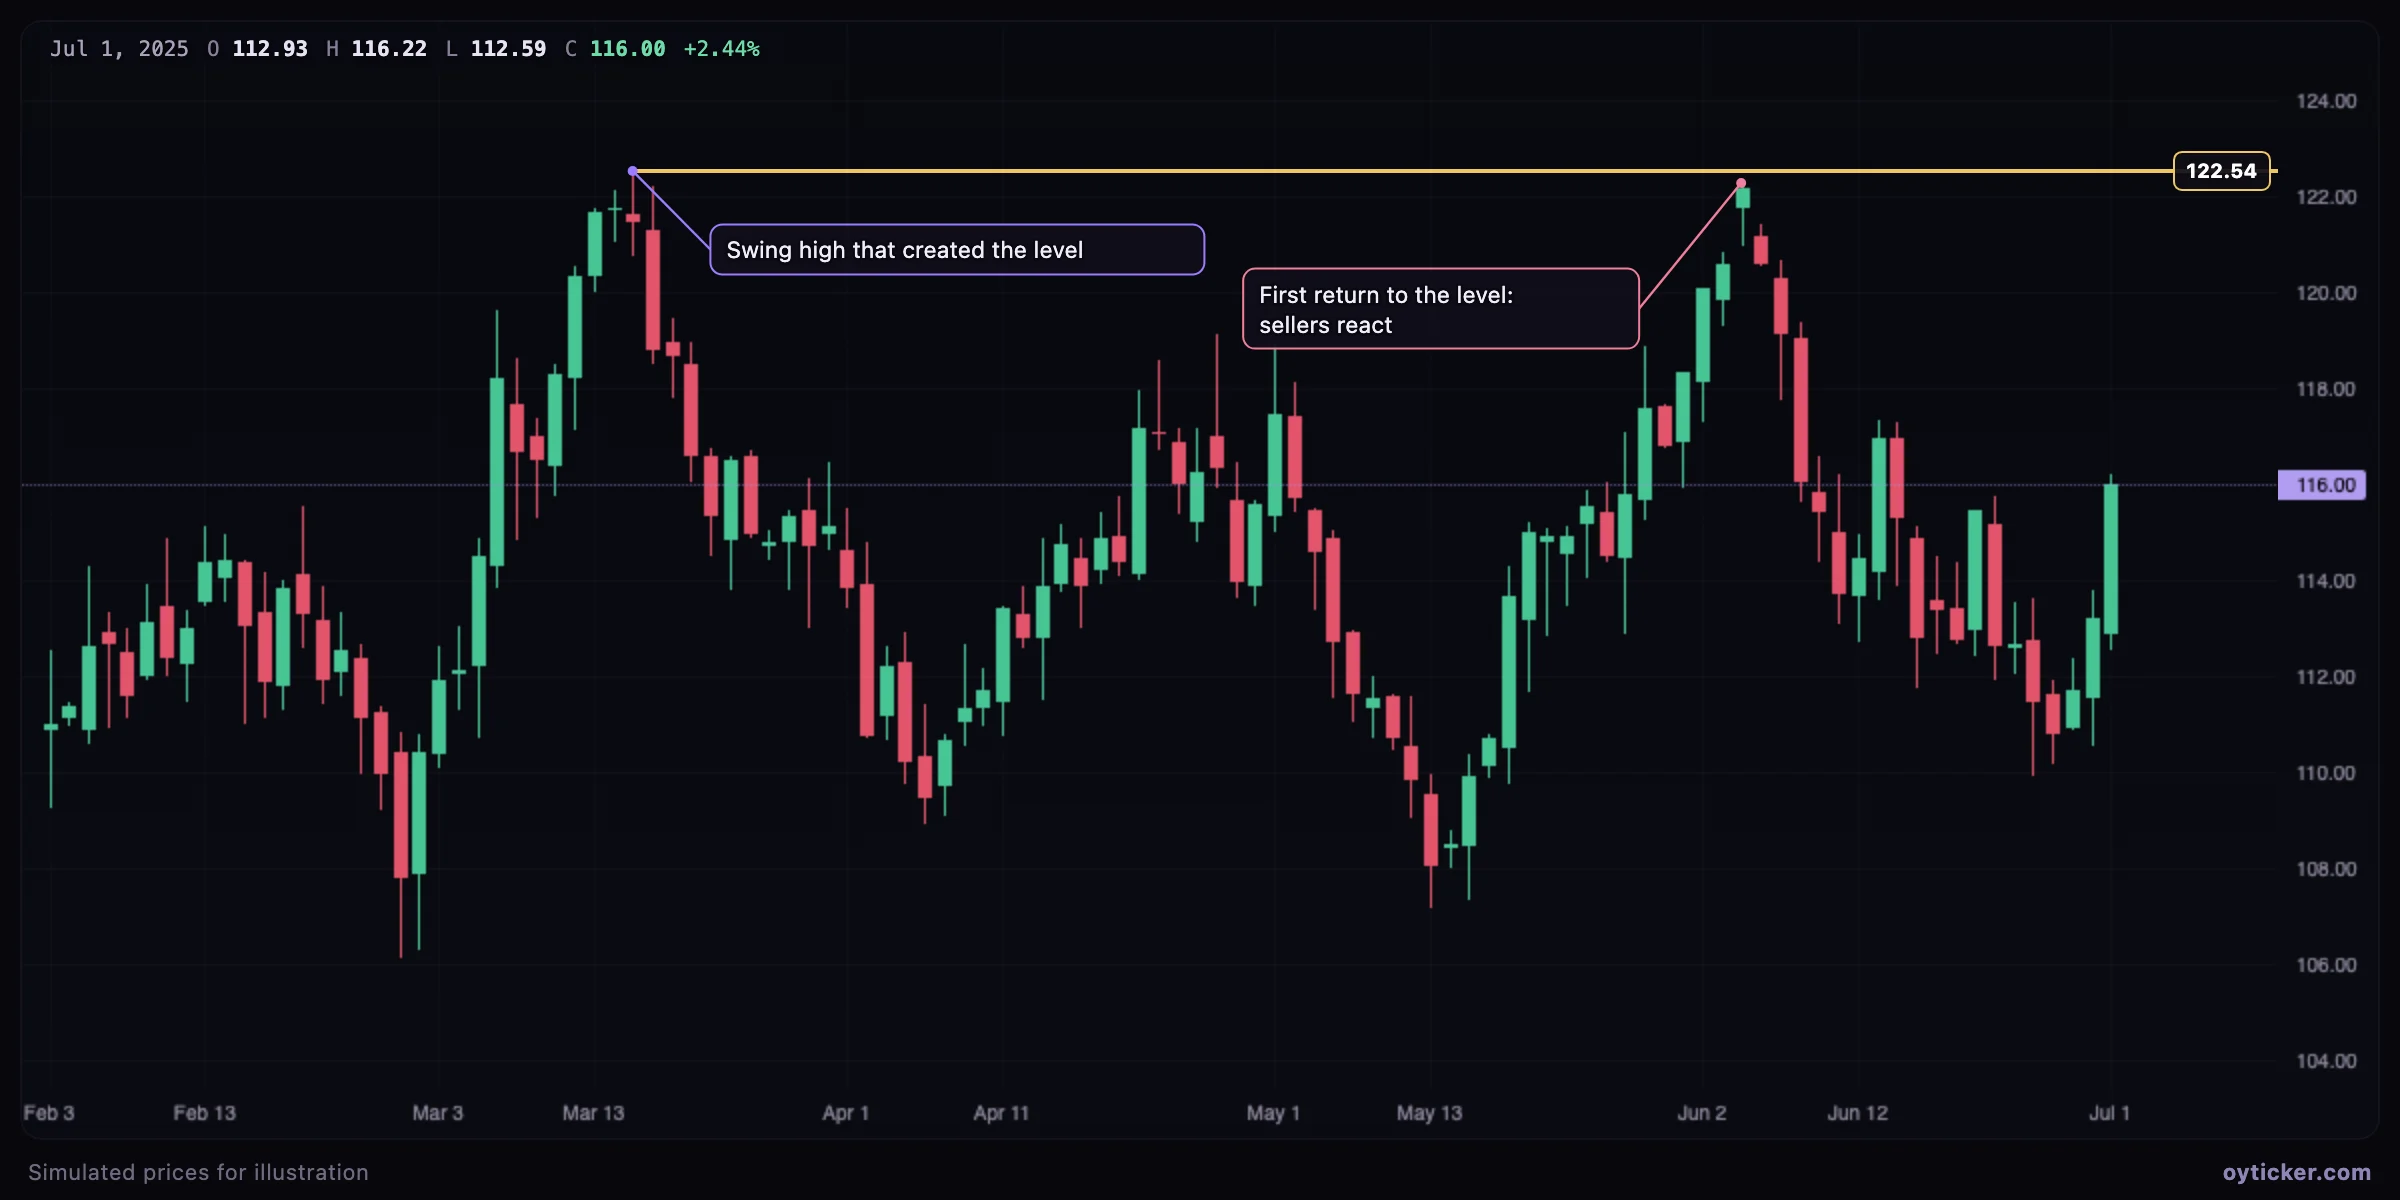
How to draw it
- Choose Lines → Horizontal ray.
- Click the candle where the level originates. With the magnet on, the ray snaps to that candle's high, low, open or close.
- The ray extends to the right edge with its price shown on the axis side.
Limits
- As with any level, the first test is the most reliable; repeated tests consume the orders resting there.
- Use a full horizontal line when the level also mattered before its origin (an old range boundary revisited).
Charts in this guide use simulated prices generated for illustration; levels and outcomes shown are examples, not observations of a real market. Educational content only, not investment advice.