
Construction
- P0 is the pivot where the move starts (a low for a rising fork).
- P1 and P2 are the next swing high and swing low (the first reaction).
- The median line starts at P0 and passes through the midpoint of P1 and P2.
- The upper and lower lines are parallel to the median and pass through P1 and P2. Oyticker also draws dashed lines halfway between the median and each outer line, and shades the inner half more strongly.
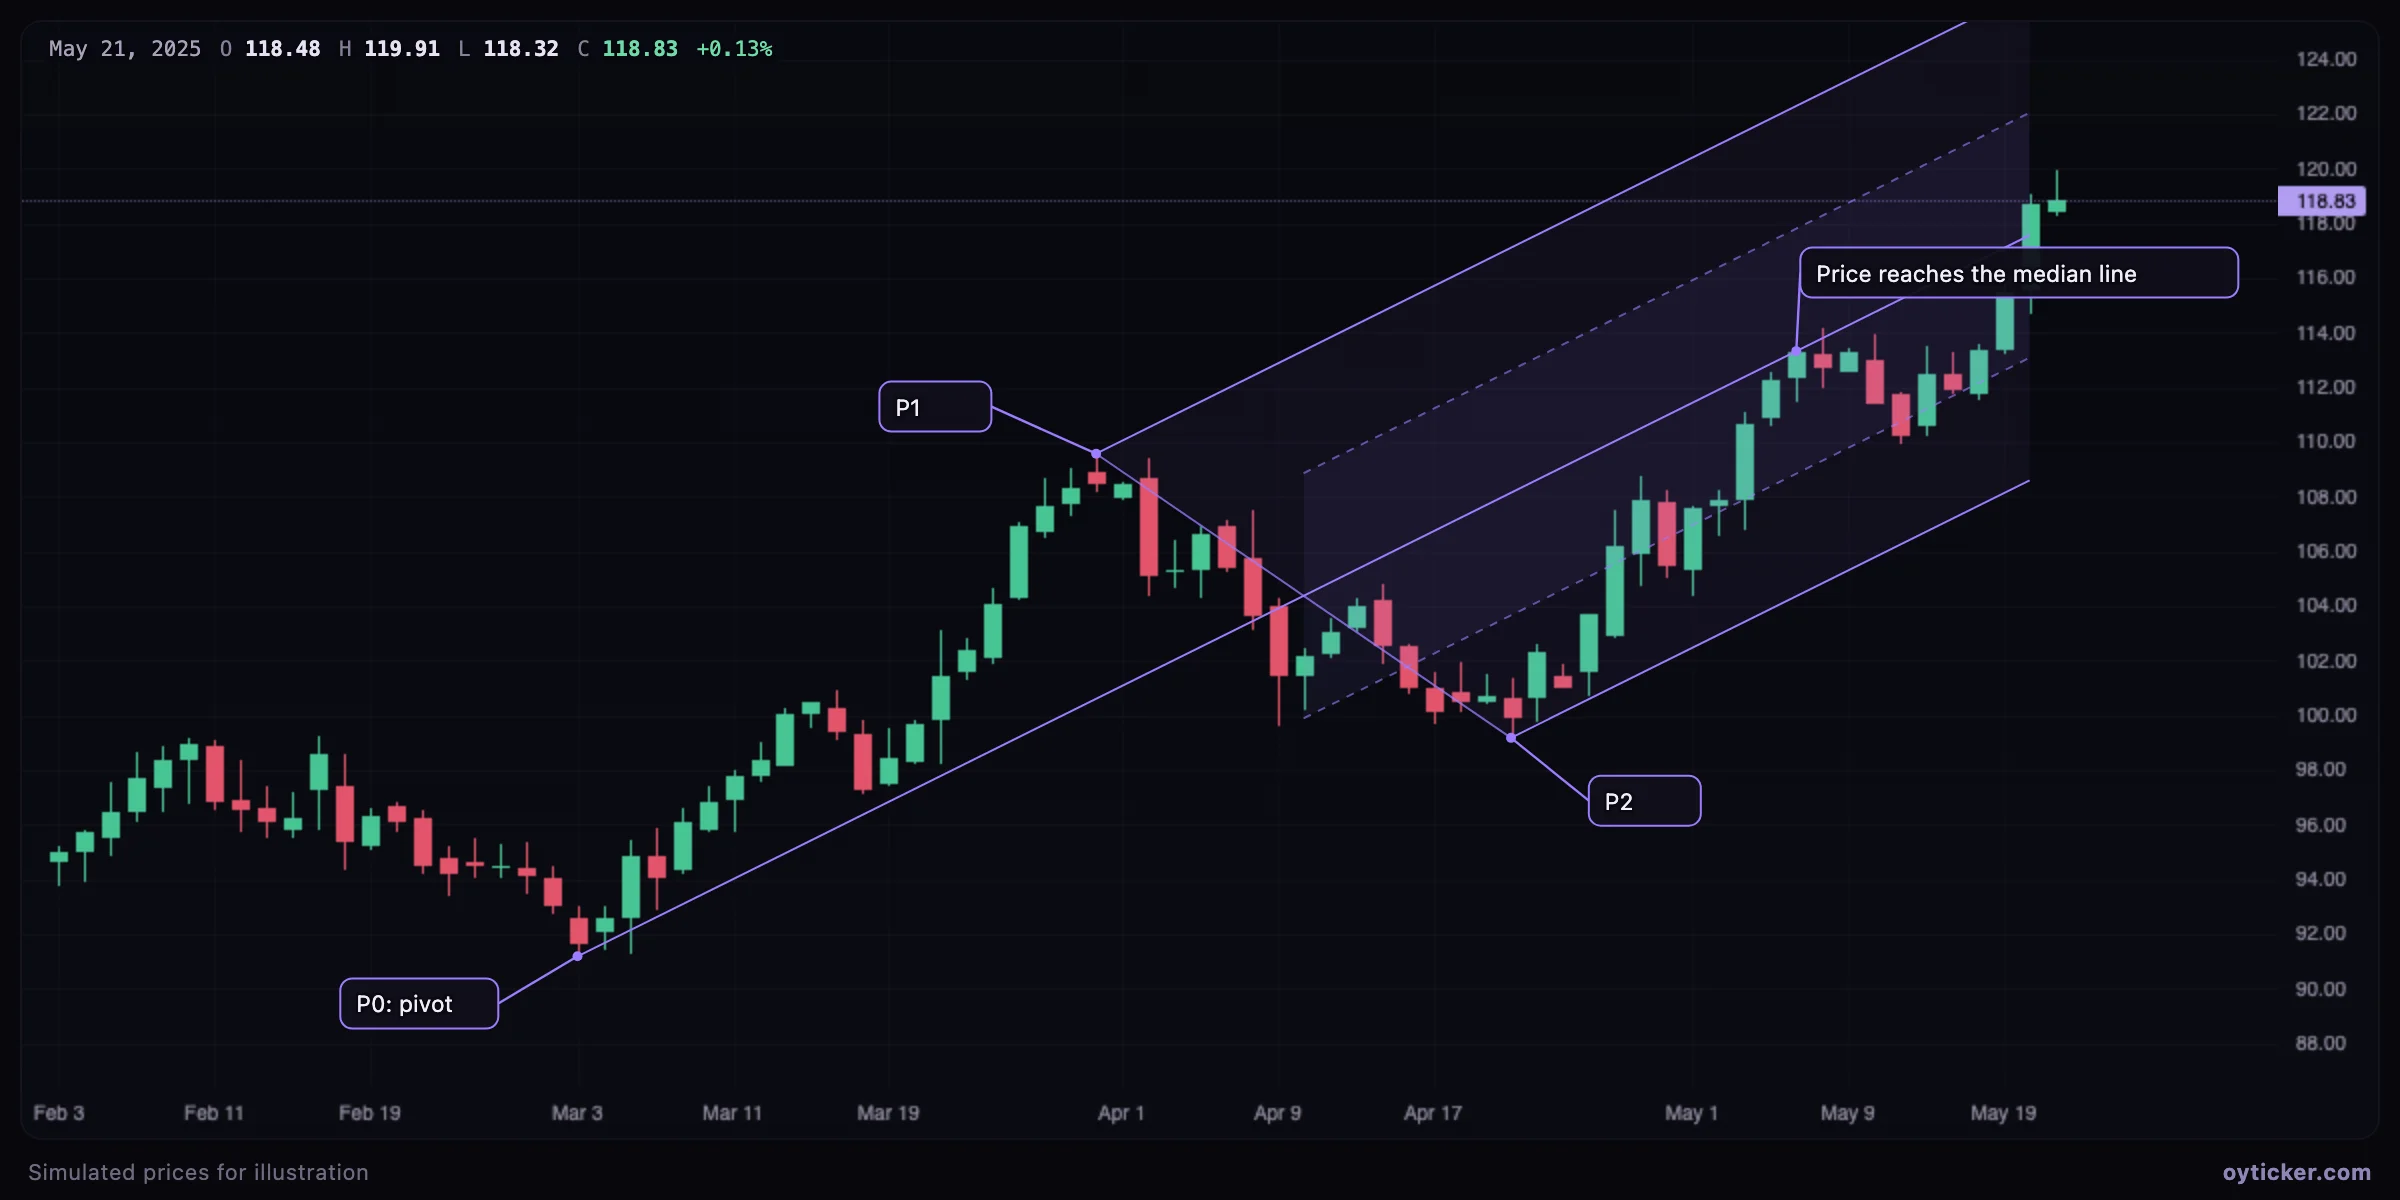
By default the lines stop at that length, which keeps the drawing proportional to the swings that define it. Extend right prolongs them to the edge of the chart.
How to draw it in Oyticker
- Choose Channels & pitchforks → Pitchfork.
- Click P0, then P1, then P2. With the magnet on, each point snaps to the candle's high or low.
- In the options, choose the variant and tick Extend right if you want the lines to run to the chart's edge.
How to read it
- Median line attraction. Andrews held that price returns to the median line most of the time; reaching it is a natural target for a move that starts at P2.
- Reaction at the median. Price often pauses or reverses on the median line; a decisive close through it opens the way to the opposite outer line.
- Outer lines act as support and resistance for the trend; the dashed half-lines are intermediate levels.
Case study: failure to reach the median line
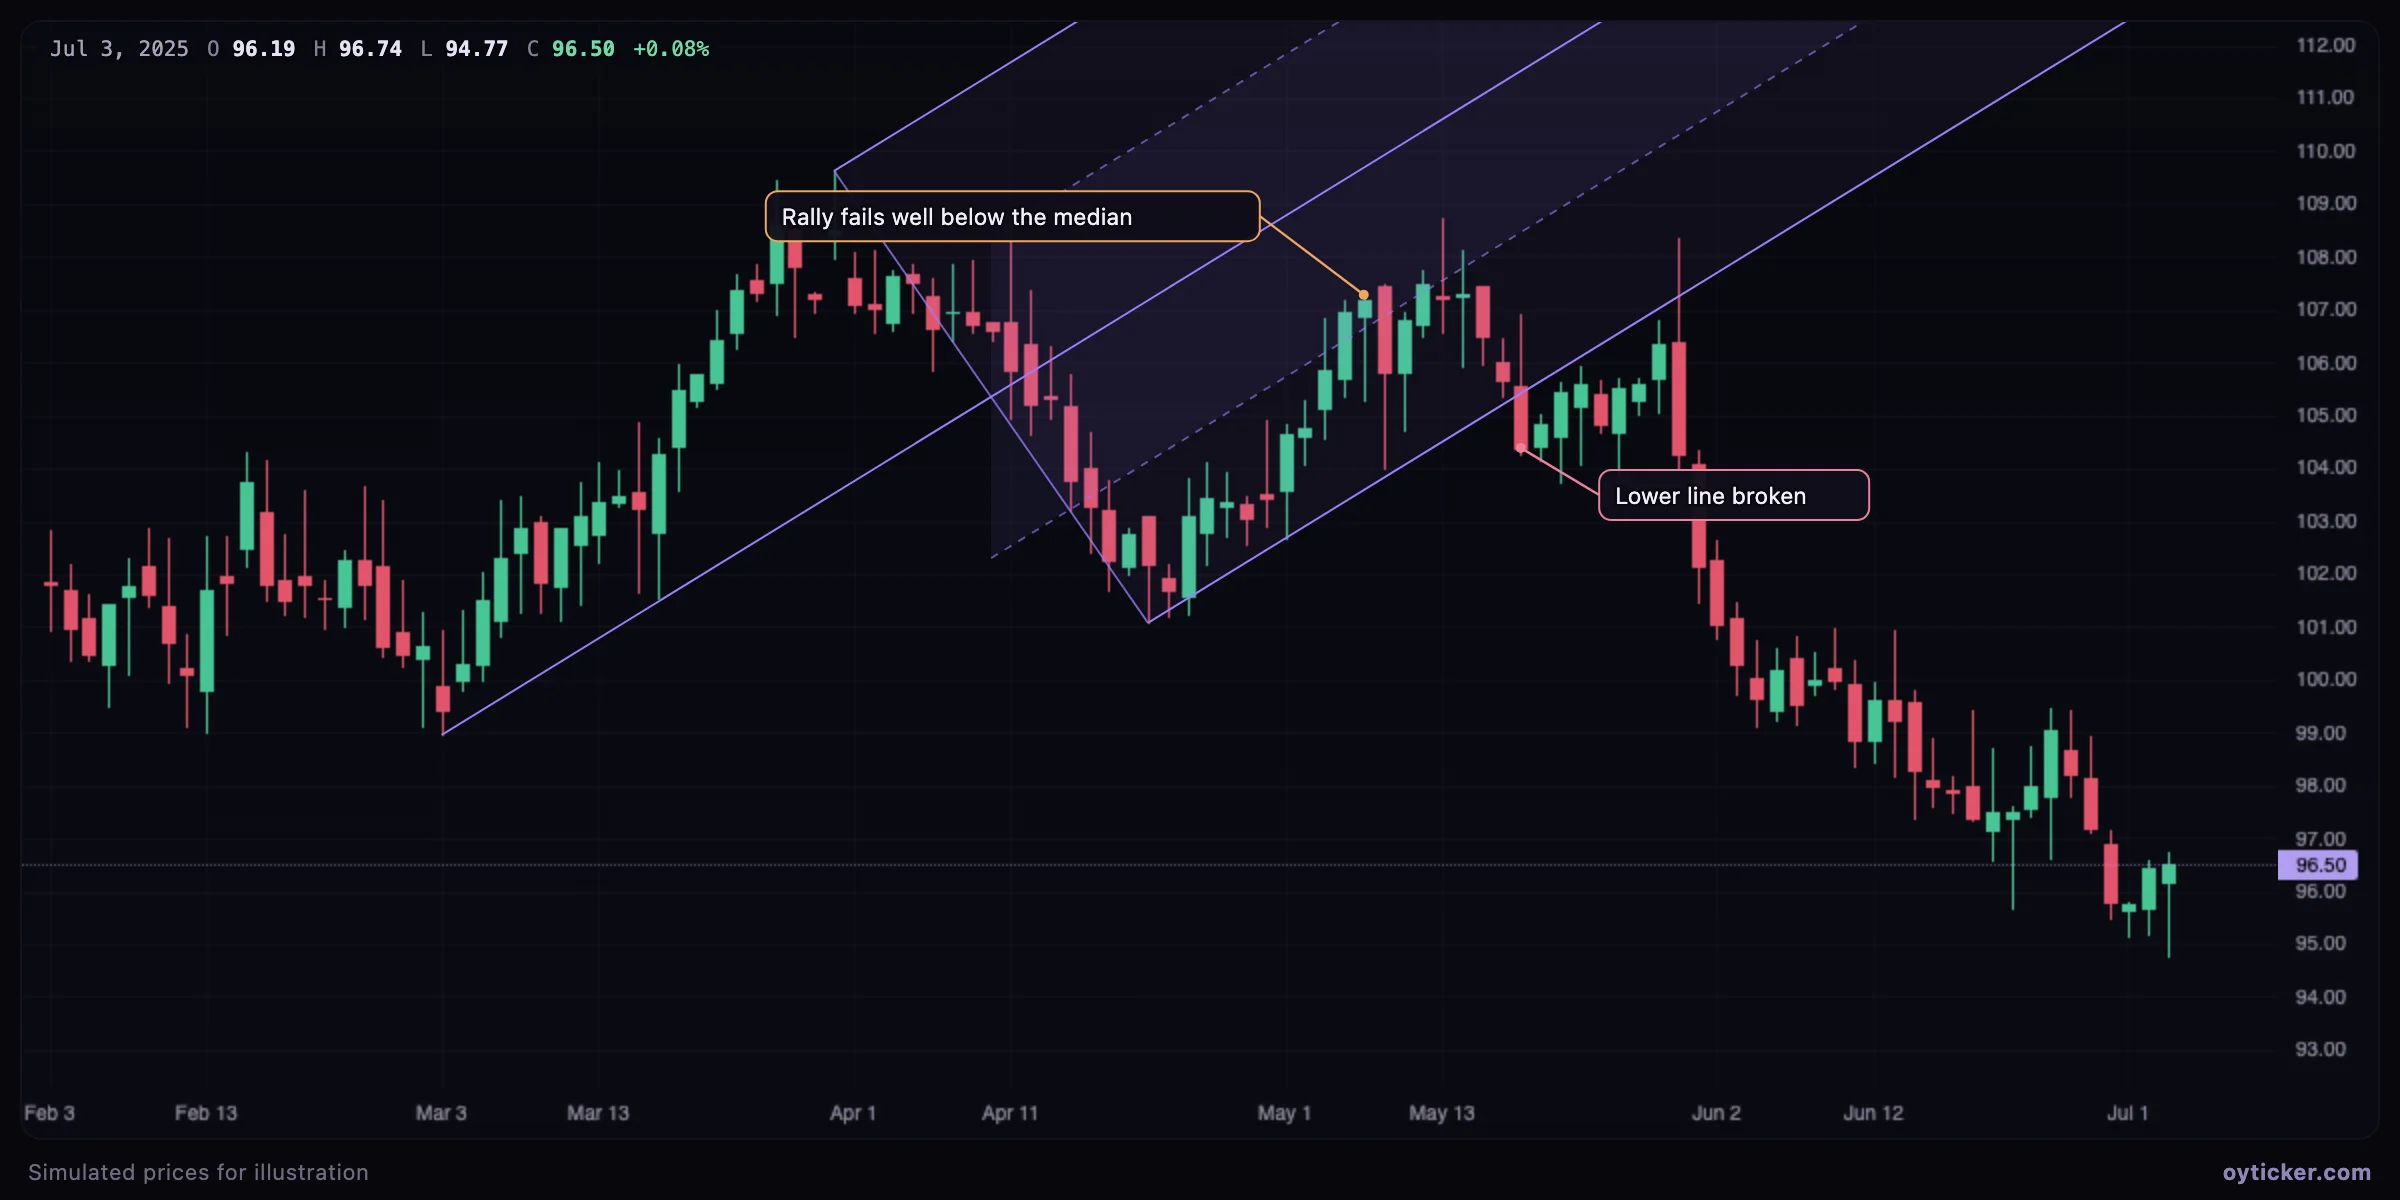
A guideline associated with Andrews' method (often called Hagopian's rule) states that when price fails to reach the median line, it is likely to move back beyond the outer line it came from, and often further than where it started. The failure shows that the force that should carry price to the median is missing.
Variants: Schiff and modified Schiff
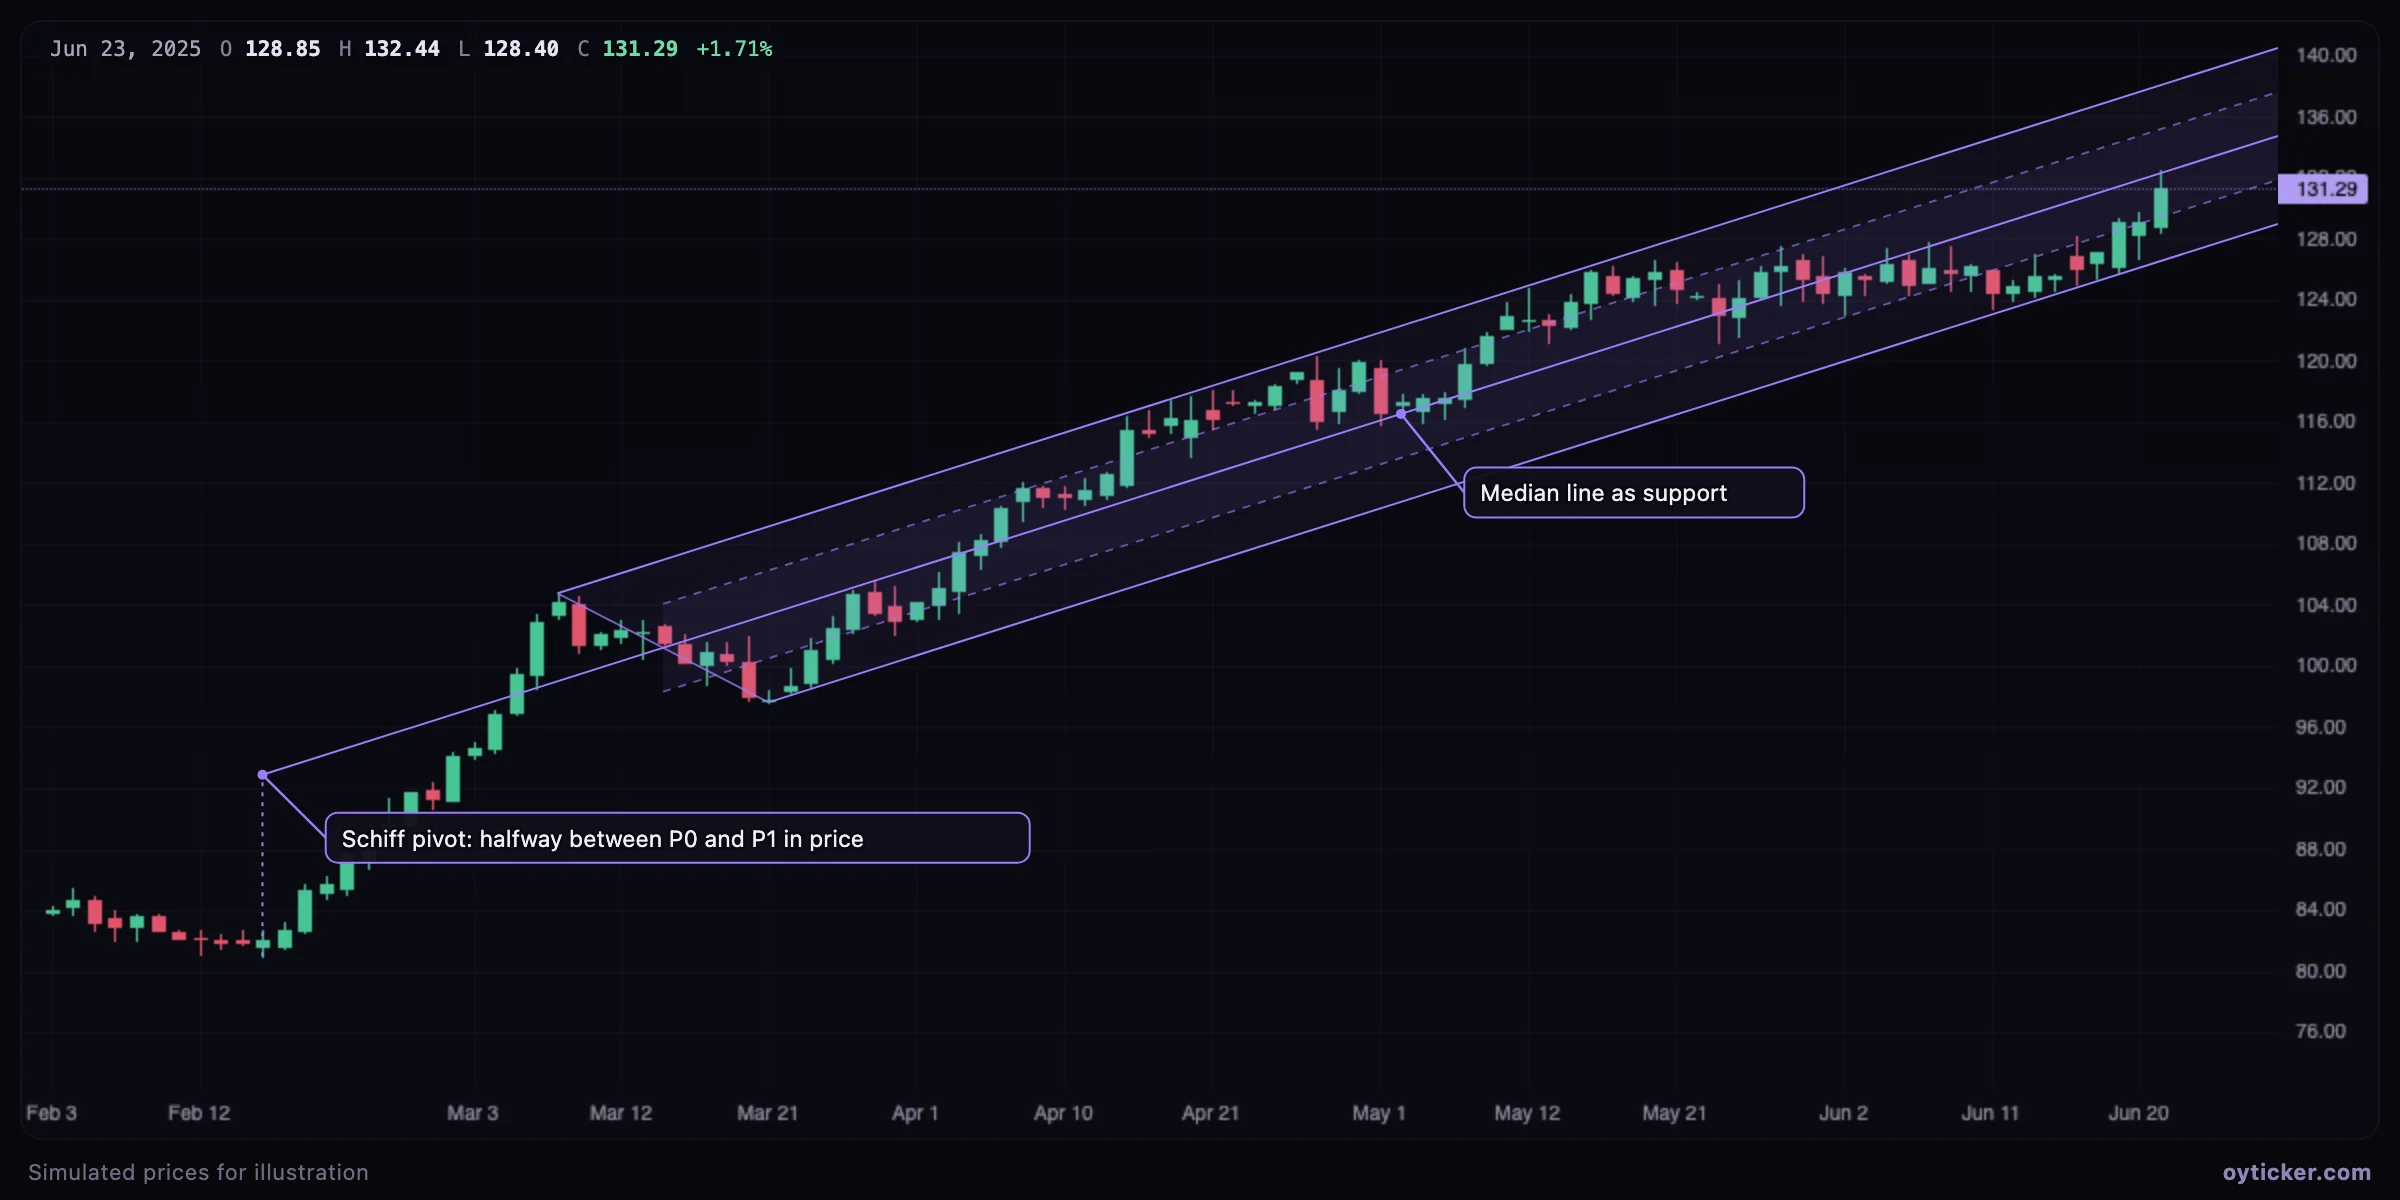
In a steep trend, the Andrews median line from P0 is often too steep: price never gets back to it. The variants move the starting point of the median line to reduce the slope; the outer lines still pass through P1 and P2.
| Variant | Origin of the median line | Use |
|---|---|---|
| Andrews | P0 | Standard fork |
| Schiff | Same time as P0, price halfway between P0 and P1 | Steeper trends |
| Modified Schiff | Halfway between P0 and P1 in time and in price | Between the two |
Limits
- Everything depends on the choice of P0, P1 and P2; two analysts with different pivots get different forks.
- Like all sloped lines, forks are sensitive to the chart's scale and to the timeframe they are drawn on.
- Median-line “attraction” is a tendency described by practitioners, not a law: always define what invalidates the scenario (for example a close beyond an outer line).
Charts in this guide use simulated prices generated for illustration; levels and outcomes shown are examples, not observations of a real market. Educational content only, not investment advice.