
How to use
Open Analyze Analyze
Analyze opens from the Analyze button of Charts. It is a full chart workspace: draw trend lines, Fibonacci levels or patterns, add indicators, change the chart type, let Tick draw his own reading of the chart, and compare with another asset. Every tool has its own illustrated guide in Learn.
The workspace
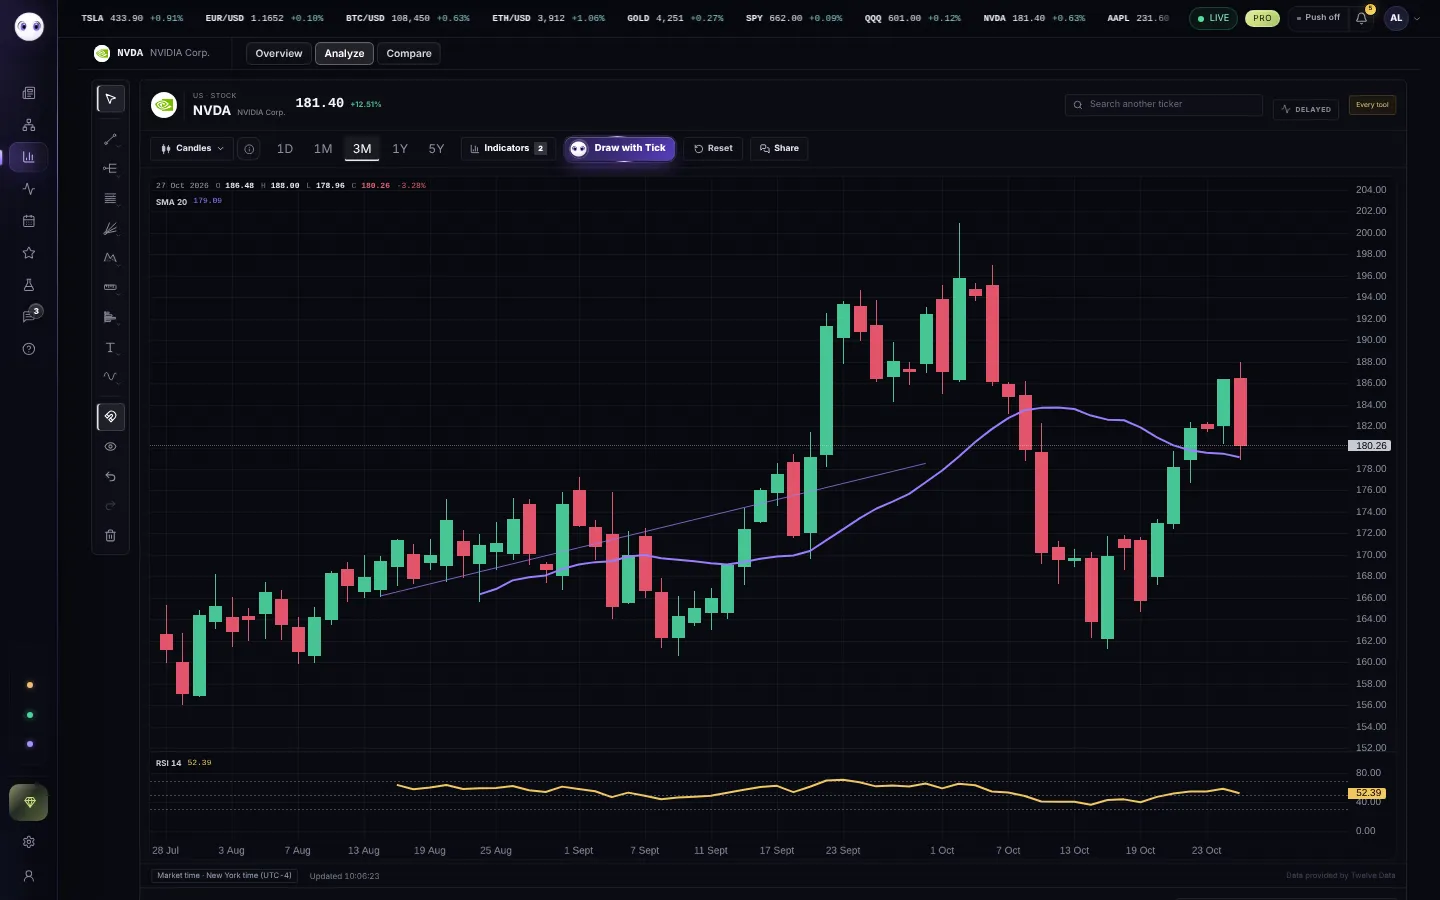
- Search another tickerOpen any other asset here, on the same period, without going back to Charts.
- The assetExchange and type, symbol and name; then the price and the change over the period shown.
- ToolbarChart type (candles, Heikin Ashi, line, area… nine in all), periods from 1D (one candle per minute) to 5Y (one per day), Indicators (the number counts those on the chart), Compare with a second asset (see Compare) and Draw with Tick, who reads the chart and draws his analysis on it.
- ResetRemoves the drawings on this asset, the indicators and the chart type, after a confirmation. Undo stays possible for 8 seconds.
- Drawing toolsThe tool groups, the magnet, hide, undo, redo and clear.
- LegendOpen, high, low, close of the candle under your pointer, and one line per indicator.
- Status barMarket time or your time, the number of drawings and indicators, and the last update.
Opening another asset
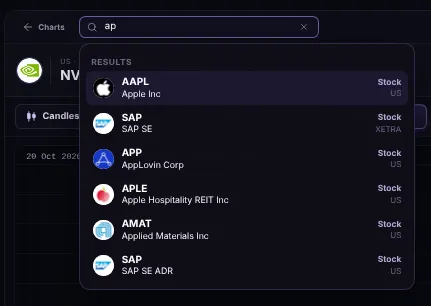
- Type a ticker or a nameYour watchlist and popular markets show as soon as you click; results follow as you type.
- Pick oneAnalyze opens on it, on the same period. ↑ ↓ and Enter work too.
Drawing on the chart
- Click a group in the left rail (Lines, Fibonacci, Patterns…), then a tool.
- Click on the chart where the tool starts, then where it ends (or press and drag). A bar above the chart tells you how many points the tool needs.
- The tool goes back to the cursor and your drawing is selected: move it, or change it in the panel that opens.
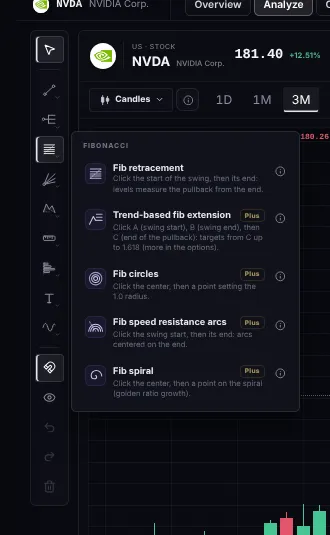
- CursorSelect and move drawings. Esc comes back to it.
- A groupNine groups: Lines, Channels & pitchforks, Fibonacci, Gann, Patterns, Projection & measure, Volume-based, Shapes & text, Cycles.
- Its toolsEach tool says how to draw it; the i opens its illustrated guide.
- Plus toolsPlus19 tools are open to every member, 22 more with Plus and Pro.
- MagnetSnaps your clicks to the open, high, low or close of the nearest candle.
- Undo, redoUp to 100 steps (Ctrl/⌘ Z, Ctrl/⌘ Shift Z).
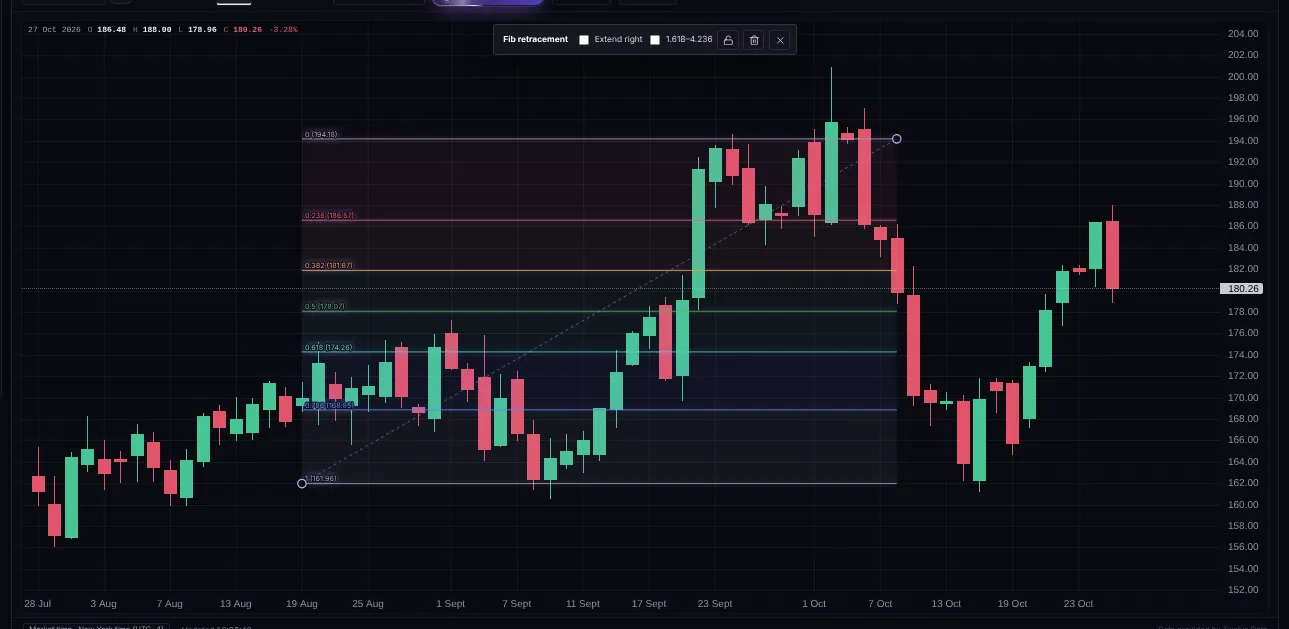
- Your drawingDrag it to move it; drag its handles to reshape it. Delete removes it.
- SettingsColour, line width and style, and the options of the tool (here the extra Fibonacci levels).
- LockKeeps the drawing from moving by accident.
Indicators
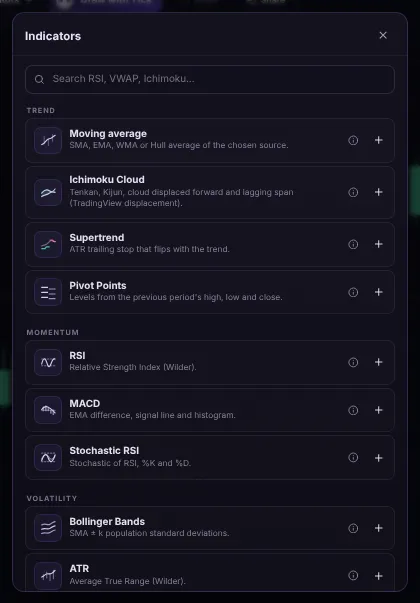
- SearchRSI, VWAP, Ichimoku…
- Add oneClick it: it appears on the chart, with default settings you can change.
- By familyTrend, Momentum, Volatility, Volume, and Custom for your own formulas.
- 6 indicators for everyone: moving average, Bollinger Bands, VWAP, volume, RSI and MACD.
- 8 more with Plus and Pro: Ichimoku, Supertrend, pivot points, Stochastic RSI, ATR, volume profile, market profile (TPO) and the custom indicator, written with a short formula.
- Point at an indicator's line in the legend: the eye hides it, the gear changes its settings, × removes it.
Chart types
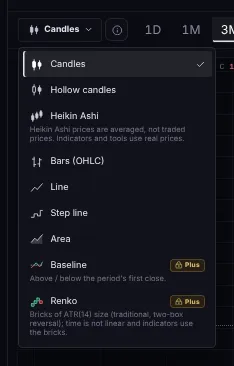
- Seven types for everyoneCandles, hollow candles, Heikin Ashi, bars, line, step line and area.
- Plus typesPlusBaseline (above or below the period's first close) and Renko (bricks of ATR size).
Draw with Tick
Click Draw with Tick: Tick reads ten years of the asset's history and draws, one tool at a time, what matters on the chart: ranges, trend lines, levels the market respects, patterns, then the range where the price usually goes next and what would change the picture.
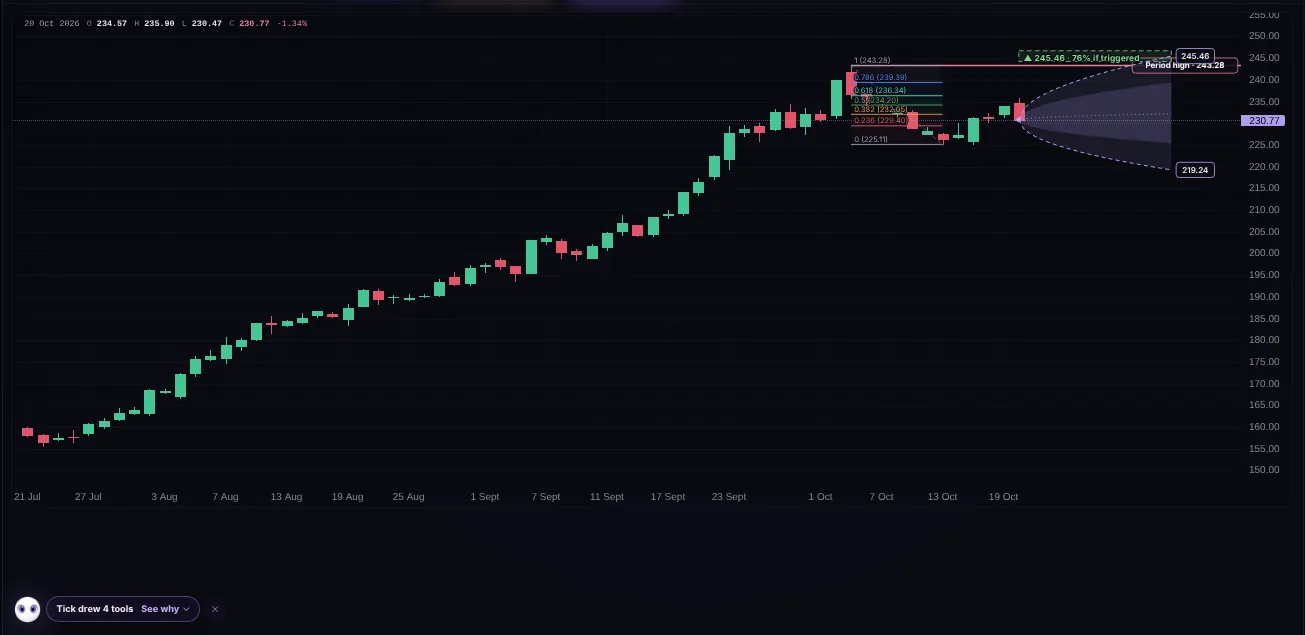
- Tick's drawingsLevels, ranges, patterns: ordinary drawings you can select, move or delete like yours. One undo removes them all.
- Where it could goThe cone of the usual range for the horizon, and the scenario if the price breaks out, with its chance.
- DoneHow many tools Tick drew; See why scrolls to his explanations.
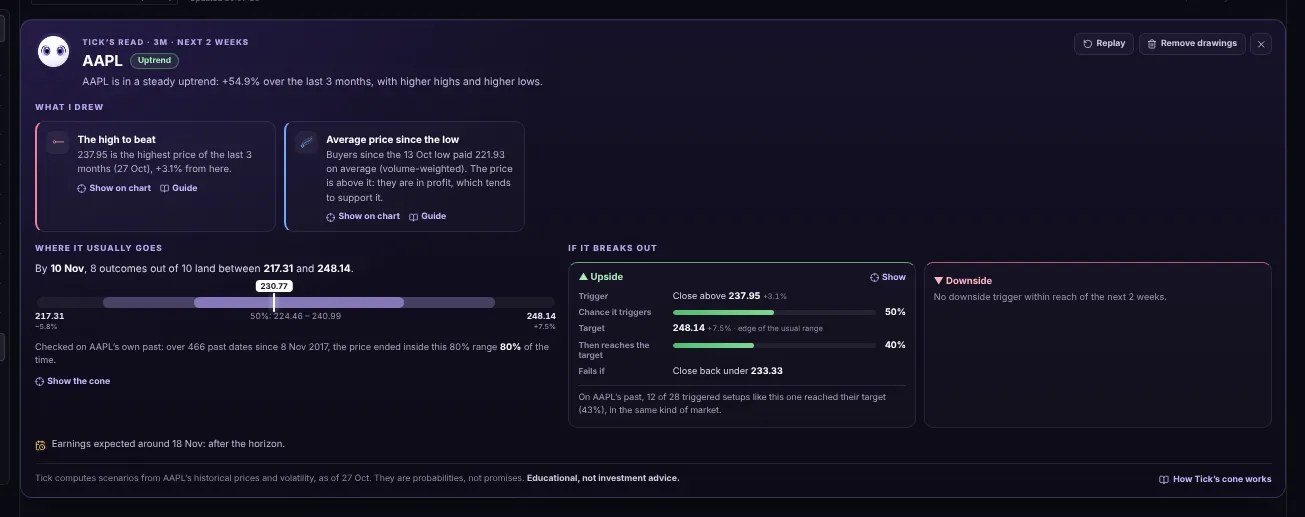
- Tick's readThe regime (uptrend, range, breakout…) in one sentence, for the period and horizon of the chart.
- What I drewEach tool and why; Show on chart selects it.
- Where it usually goesThe range where 8 outcomes out of 10 landed on the asset's own past, and how often that held.
- If it breaks outThe upside and downside triggers, their chances and targets, measured on the asset's history.
Under the chart
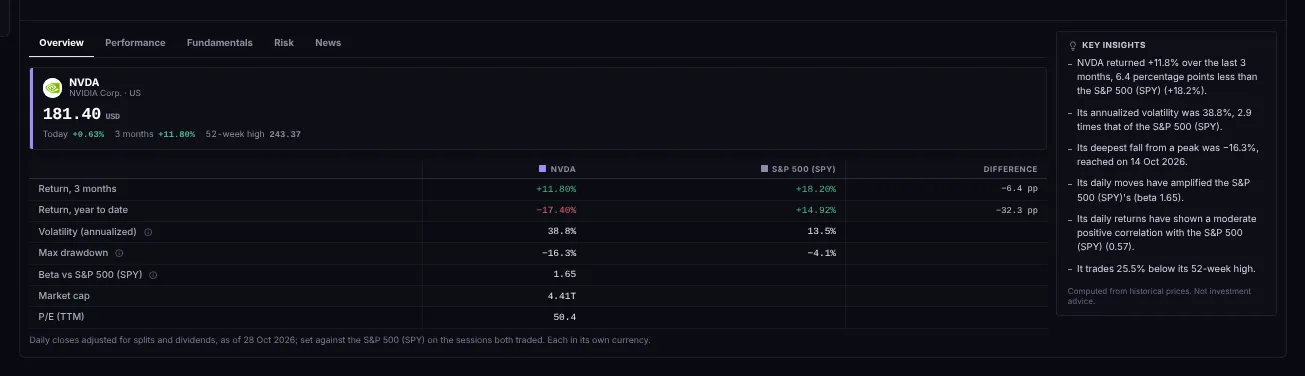
- Five sectionsOverview, Performance, Fundamentals, Risk and News.
- The assetPrice, today's change, the period's return and the 52-week high.
- Against its benchmarkReturns, volatility, worst fall and beta, side by side with its market's index.
- Key insightsThe points that stand out, in plain words, computed from prices.
Free, Plus and Pro

- Plus toolA Plus tool picked on a Free account says so, with a link to the plans.
- Free: 19 drawing tools, 6 indicators, 7 chart types, Tick on one asset a day, 3 comparisons a day.
- Plus: all 41 tools, 14 indicators with custom formulas, every chart type, Tick on 15 assets a day, unlimited comparisons.
- Pro: everything in Plus, Tick without limit, and saved comparisons with image and CSV export.
Screenshots use simulated prices and stories.